TE 589A
North Carolina State University (NCSU)
Under the Direction of:
Dr. Michael S. Slocum
Adjunct Assistant Professor, NCSU
Dr. Tim G. Clapp
Professor, NCSU
Introduction
Evolution in stages is a macrolevel technology aimed at the maturity mapping of an existing technology. The stages of the s-curve are pregnancy, birth, childhood, adolescence, maturity, and decline. Four curves plot the maturity of a technology from different perspectives: performance, level of inventions, number of inventions, and profitability, see fig.1. The interpolation of these individual curves gives the analyst an indication of the technology location on the s-curve.1

DVD Technology
DVD (Digital Versatile Disk) technology is a collection of new optical-disc technologies that have the potential to significantly improve the quality of a number of consumer electronics and personal computer products. DVD technology is intended to eventually replace a number of separate technologies. DVD-ROM replaces CD-ROM, DVD-Audio replaces CDs, DVD-V replaces CDs, and in addition two new technologies, DVD-R, a high speed write once disc and DVD-RAM, a high speed read write disc were introduced. DVD technology was selected as a prospect for maturity mapping due to find out if DVD technology like laser disc technology declines soon after its introduction.2
Number of inventions
The number of patents in DVD technology were collected from the USPTO (U.S. Patent and Trademark Office) database and these figures were plotted for each year since the first patent as shown in fig.2.3

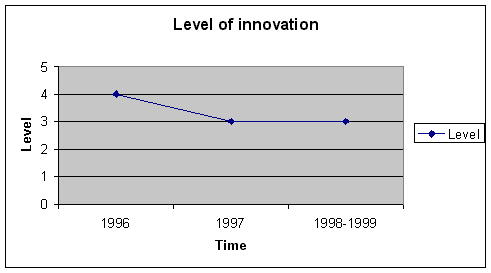
Level of innovation
The level of innovation was determined by analyzing the patents, based on the scope of knowledge, the impact on science, the presence of technical contradictions, change in characteristics and the experiments required.4 The average levels of innovation for the patents are plotted in fig.3.

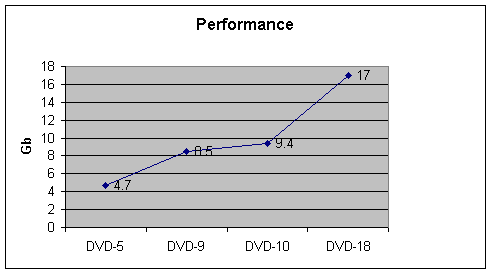
Performance
The storage capacity of the DVD was taken as the performance characteristic. For each new format of DVD, the storage capacity has been increasing from 4.7Gb to 17Gb.5 The storage capacity was plotted against time as shown in fig.4.

Figure 4
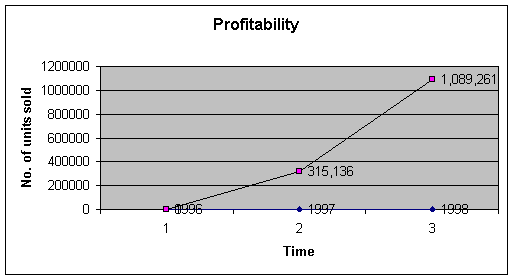
Profitability
DVD-Player sales were taken into account to plot the profitability of the DVD technology. The sales figures were obtained from CEMA (Consumer Electronics Manufacturing Association).7 The sales figures were plotted for each year as shown in fig.5.

Figure 5
Conclusion
The stage indicators clearly place the DVD technology in the growth stage, which indicates that the technology is not in the declining stage like the CD or laser disc technology.
Michael S. Slocum, “Technology Maturity Using S-Curve Descriptors”
http://www.thedigitalbits.com/gendvd.html
http://164.195.100.11/netacgi/nph-Parser?Sect1=PTO2&Sect2=HITOFF&p=1&u=/netahtml/search-bool.html&r=1&f=G&l=50&co1=AND&d=pt96&s1=dvd&OS=dvd&RS=dvd
http://164.195.100.11/netacgi/nph-Parser?Sect1=PTO2&Sect2=HITOFF&p=1&u=/netahtml/search-bool.html&r=2&f=G&l=50&co1=AND&d=pt97&s1=dvd&OS=dvd&RS=dvd
http://164.195.100.11/netacgi/nph-Parser?Sect1=PTO2&Sect2=HITOFF&p=2&u=/netahtml/search-bool.html&r=54&f=G&l=50&co1=AND&d=pt97&s1=dvd&OS=dvd&RS=dvd
http://164.195.100.11/netacgi/nph-Parser?Sect1=PTO2&Sect2=HITOFF&p=2&u=/netahtml/search-bool.html&r=52&f=G&l=50&co1=AND&d=curr&s1=dvd&OS=dvd&RS=dvd
http://164.195.100.11/netacgi/nph-Parser?Sect1=PTO2&Sect2=HITOFF&p=2&u=/netahtml/search-bool.html&r=100&f=G&l=50&co1=AND&d=curr&s1=dvd.PPDB.&OS=SPEC/dvd&RS=SPEC/dvd