|
|
|
|||||||||
|
|||||||||
By Jack Hipple
Air traffic controllers face a multitude of critical decisions in their daily activities, usually under stressful conditions. If not well designed, the displays they use can be confusing and interpreted in different ways. The need to display additional information intended to help the controller conflicts with the focus he needs to do the job and minimizes the importance of distinguishing among information that is critical, important or merely record-keeping in nature.
The author ran an introductory Theory of Inventive Problem Solving (TRIZ) session with a major designer and supplier of air traffic control systems and displays, focusing on the human factor aspects of the design of air traffic control displays. This article explains the challenges of air traffic control display design from a human factors standpoint and lays out the application and idea generation resulting from the application of TRIZ principles to the improvement of air traffic control systems.
Air traffic control (ATC) displays are vital to commercial, private and military aircraft safety. It is critical for controllers to understand the information presented on a display, interpret that information and then react to it in sufficient time and clarity to instruct aircraft on directional, altitude and avoidance procedures. Occasionally, this requires split-second decision-making. The manner in which an ATC display presents information is critical to all these tasks being performed in an optimal fashion. Complicating the situation has been a series of mandates from the Federal Aviation Administration (FAA) that spell out additional display information.
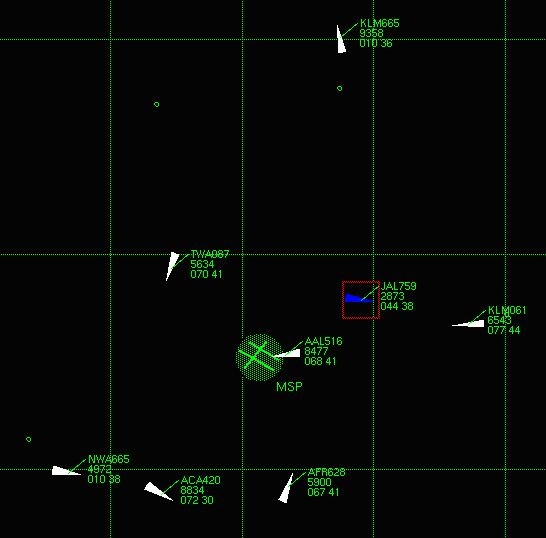
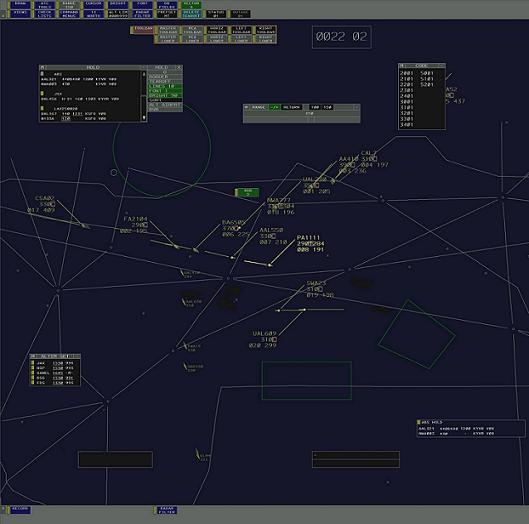
Pictures of typical ATC displays are shown in Figures 1 and 2. These screens show locations, directions and altitude of all aircraft within a given radius of responsibility of a given controller. As aircraft travel to their destinations, "handoffs" occur between various ATC centers in designated locations. Common language and acronyms are used in the aviation industry to ensure commonality of communication and instruction. The graphical user interface (GUI) is an important component in helping people interpret and react to visual stimuli. The environment in which this interaction occurs – noise level, time of day, number of aircraft in the area and other conditions – is also important.
| |||||
| |||||
It is critical for designers of ATC displays to understand how each individual may respond to the display. Likewise, they need to attempt – to the best of their abilities – to present information in a way that assists controllers and takes into consideration different human reactions to data presentations. Optimizing the human factors aspects of ATC displays can minimize training costs and equipment changes. Simple items such as the color of displayed information can have a major impact on data interpretation. In a TRIZ sense, the ideal result is for only the information needed to be presented when it is needed and in the format that maximizes the soundness and speed of that particular controller's response.
Stretching this a bit further and looking up a level in a conventional TRIZ 9 windows structure, it is also possible to say that the function of the controller should be performed without human intervention. (This is beyond the scope of this article; but it is the subject of current FAA research exploring the use of satellite information to minimize the need for human interpretation and decision-making.)
It is frequently said that any ATC display design involves trade offs. Anyone in the TRIZ community would recognize this stance as compromising – and an area ripe for breakthrough problem solving.
The fundamental conflict surfaces between display engineering (data that is desirable to display – usually by the FAA) and computer human interface (CHI) engineering (how the user interacts and makes decisions from that display). Display engineering involves data, formatting, coding and layout. CHI design involves function definition, interpretation and interaction. A simple example of conventional problem solving in this area is the replacement of knobs and bulbs with "picks," allowing undeterred focus of the controller on the screen. Another conventional approach is to analyze newly required data and determine the best placement, the period of placement, whether it replaces an existing display and the like. The overall challenge is to manage the "glass space."
Prior to the introductory session, conventional approaches to some of these challenges included:
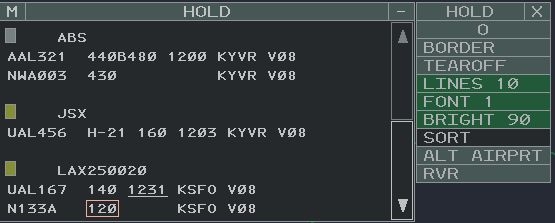
Figures 3 and 4 show prototype display screens using some of these concepts, where a pop-up is displayed when the user touches a particular data section on the normal display – separation in time or upon condition.
| |||||
| |||||
Figures 3 and 4 show prototype display screens using some of these concepts, where a pop-up is displayed when the user touches a particular data section on the normal display – separation in time or upon condition. What cannot be seen in the following figures is the dramatic reduction in keystrokes that occurs by analyzing data patterns.
This particular TRIZ session was sponsored by the human factors group within a major air traffic display manufacturer. The team completed a problem analysis and ran an abbreviated on-site session with a group of eight human factors designers plus a few experts from related areas. This introductory session reviewed the history of TRIZ, some of its more basic problem-solving tools including the ideal final result, resource use and identification, contradictions and the use of separation principles, the 40 inventive principles and the contradiction matrix. Some initial problem diagramming with TRIZ software was also performed.
Though the details of the session are proprietary, some of the general concepts that were reviewed and considered for future ATC designs can be shared. It is best to review these in terms of some basic TRIZ tools.
In TRIZ, it is recognized that there are few if any new problems. The challenge is to broaden the problem definition in such a way as to find general solutions that are already in use and that may apply. This is frequently represented by many TRIZ professionals as shown in Figure 5.
| |||||
It is not unusual for people to believe that they are the only ones who have faced the problem they have, but this is almost never the case. The challenge is to stop using jargon and industry-specific language and generalize the problem to enable the identification and use of generic solutions.
What other industries or technologies face the problem of dynamic graphical data presentation incorporated into a decision-making process? Certainly, computer screens and their touchscreen equivalents, voting machines and chemical process control displays come to mind. In this last case, there are almost exactly the opposite requirements of an ATC display. An ATC display constantly changes, and the controller must react. In the case of a chemical process, which might run 24/7 at a given set point, what is important is for the changes – not the routine – to be obvious. Another parallel universe of critical data and display awareness would be nuclear power plant controls.
It would be important in future planning and problem solving in the ATC display area to be aware of developments in these other areas – to read the appropriate literature and attend technical meetings. Part of the output of this session was to produce a list of parallel universe technologies and related literature for later exploration by the client. These included the Center for Chemical Process Safety, display consortiums and various human factors studies done by the FAA and academia.
| Table 1: Parallel Data Display Technology Areas | |
| Technology | Similarities to ATC Display |
| Voting machines | Simple display but record retrieval critical |
| Computer screens | Less complicated and more freedom allowed |
| Nuclear power plant control displays | Criticality and consequences equal to ATC displays; typical display is routine and not dynamic |
| Chemical plant process control displays | Criticality and consequences equal; typical display is routine and not dynamic |
In TRIZ problem solving and analysis, sub-systems and super-systems for resources and evolutionary trends are often examined. In this particular case, that encompasses environmental complexity, organizational complexity, display complexity and cognitive complexity.1
Figures 6 shows an example of an ATC room. It is easy to imagine the potential interactions that might come into play in terms of a specific controller's activities and responses. Cognitive complexity is the key focus here, as the current environment of the controller environment and the cognitive complexity (currently assessed by hiring examinations) is fixed. These sub- and super-systems provide areas for redesign consideration for future ATC environments.
| |||||
Since this was an introductory session, only basic TRIZ tools were used. The contradiction table was one of these tools.2 Table 2 shows the two contradictions present in the area of ATC displays.
| Table 2: Contradiction Table | ||
| Desired Improving Parameter | Undesired Result | Suggested Principles |
| Aesthetics/appearance | Loss of information | Local quality, nested doll, color changes, preliminary action, asymmetry |
| Loss of information | Safety/vulnerability | Preliminary action, mechanics substitution, intermediary, nested doll |
| Amount of information | Area of stationary object | Color changes, taking out, local quality, intermediary, another dimension |
It is noteworthy that the preliminary action and nested doll principles show up for both contradictions.
Local quality suggests using non-uniformity (shape or color, for example). This is what is being researched and evaluated, according to FAA reports. In addition, FAA research highlights another basic TRIZ concept: the tradeoff among simplicity, added functionality and complexity. FAA research shows that increasing use of color increases accuracy – up to a point. Beyond a certain point (three or four colors), it adds confusion and complexity.3 This is identical to the simplicity and complexity used in TRIZ to decide whether to add useful functionality or "trim." The use of asymmetric geometry in symbols can draw attention to special situations such as near collisions or unknown aircraft. The preliminary action concept can be used to "ramp up" information as a function of air traffic volume or special weather situations in a particular area.
The use of the nested doll concept suggests that instead of all FAA-required information being displayed at all times, a pick on the screen or a situational event could expose information underneath the primary data point.
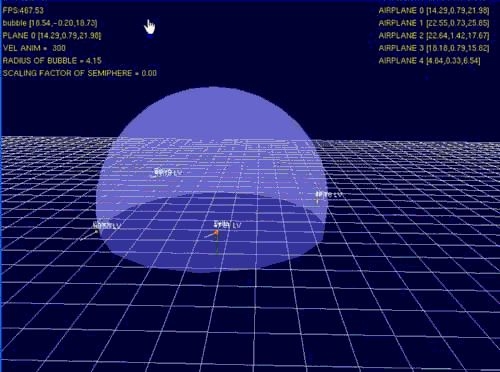
The most basic contradiction, information versus area, suggests four inventive principles, all of which are under study. These are color change (just discussed), taking out (eliminating information not needed at a particular time), local quality (expanded data, mentioned previously) and another dimension. Figure 7 shows an example of a three-dimensional ATC display currently under investigation.
| |||||
There is a lot of active research in these areas and simple TRIZ analysis reinforces these approaches.
Figure 8 illustrates a basic issue in air traffic control: Flight volume and controller attention varies by the time of day. During the day, flight operations at Los Angeles International (LAX) per hour vary between 65 and 110; it drops to only five per hour after midnight.
| |||||
In a study done by the NASA Ames Research Center, controllers were asked to identify which situations or conditions would improve their ability to analyze and respond when highlighted or accentuated. The most important condition identified was weather, followed by transitioning aircraft, such as an aircraft transitioning from one region's ATC responsibility to another. This research was part of the previously mentioned research aimed at identifying how color could be used to bring special attention to these situations.
Another conflict in this area is the increasing demand by the FAA for additional information to be presented within the ATC display. A recent San Jose State University study has shown the viability of separation upon condition or time.4 The required information is not constantly displayed, but shown only upon certain conditions that require its use.
A short cause and effect modeling session with commercial TRIZ software to graphically illustrate some of the issues of concern was also run. One of the diagrams generated is shown in Figure 9.
| |||||
The output of the software algorithm was as follows, illustrating all the conventional TRIZ thinking routes, including the ideal final result, contradiction resolution, alternative approaches, resource recognition and next generation suggestions.
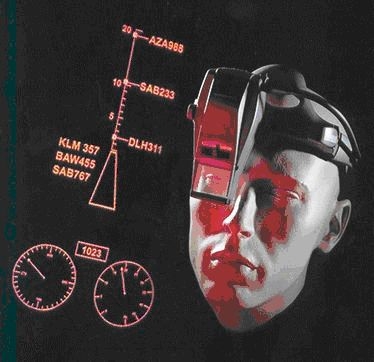
From multiple TRIZ perspectives an ideal result would be that the function of the air traffic controller is performed without the existence of the controller – using the resources already at hand. A trimming perspective could also produce this outcome. It is important to constantly review what resources are available over time as technology changes. In this case, there are now GPSs that did not exist when the original ATC function was designed. There is an evolution of a system where, using these resources, the planes can guide themselves.5 Another view of the future is illustrated in Figure 10.
| |||||
In this embodiment (which resembles recent TV and gameshow illustrations), the information is supplied to the controller without relying on a physical display (the ideal final result of the display performs its function and does not exist).
There are three primary action items that resulted from this exercise:
Note: This paper was originally presented at The Altshuller Institute's TRIZCON2008.
Jack Hipple is a principal with Innovation-TRIZ. He is the TRIZ instructor for AIChE/ASME and does TRIZ workshops for ASQ, PDMA and the Human Factors and Ergonomics Society. He has written TRIZ articles for The TRIZ Journal, Quality World, Mechanical Engineering, World Futures Quarterly, Creativity and Innovation Management's inaugural TRIZ issue, as well as a special three-part series on TRIZ for Chemical Engineering Progress. Contact Jack Hipple at jwhinnovator (at) eartlink.net or visit http://www.Innovation-TRIZ.com.