by
Michael S. Slocum, Ph.D.
Chief Scientist / TRIZ Scientist
The Inventioneering Company
Costa Mesa, CA
714.641.0677
slocum1946@aol.com
Abstract
Macro-level evolution as a function of time can be applied to four descriptors to plot the maturity of a technology and thereby indicate the primary course for maintaining technological supremacy. This pattern of design evolution is based on a primary discovery of Altshuller: the evolution of a product or technology parallels the micro-evolution of biological systems (the biological s-curve). Researching data relevant to critical performance criteria of a technology, the number of inventions in this technological field, the levels of the aforementioned inventions, and the profitability of the primary resultant of the technology in question will allow interpolation and correlation of data that will indicate the resultant location on the s-curve. The derived location on the curve (pregnancy, birth, childhood, growth, maturity, or decline) will indicate to the technology management what posture should be assumed: further investment in the current technology, stasis, or various levels of research and development for a technology that will replace the current technology, post decline. A careful study will yield valuable information based on data and the statistical analysis of this data in light of the Theory of Directed Evolution. This unique ability of the theory of innovative problem solving demonstrates its versatility and power concerning design and development.
A reduction to practice of this theory will be demonstrated by the presentation of a case study concerning the direction of hermetic technology. The methods of obtaining the data, the methods of analysis, the raw and post analysis data, as well as the s-curve plot will be presented. Management’s decisions as well the resultants of those decisions will be presented (e.g., research and development conducted according to various patterns of evolution: increased ideality, the application of limited additional resources, etc.,…). The theories ability to assist in the generation of intellectual property will be demonstrated by the presentation of a patentable technical evolution of the current technology that resulted in new products that will increase capabilities as well as market shares for the organization well into the 21st century.
1.0 Introduction
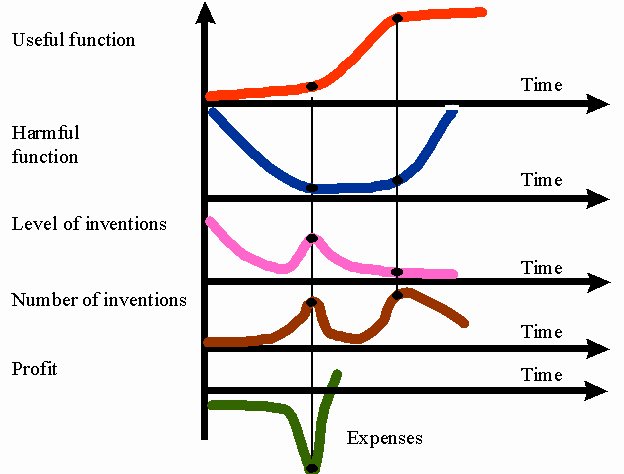
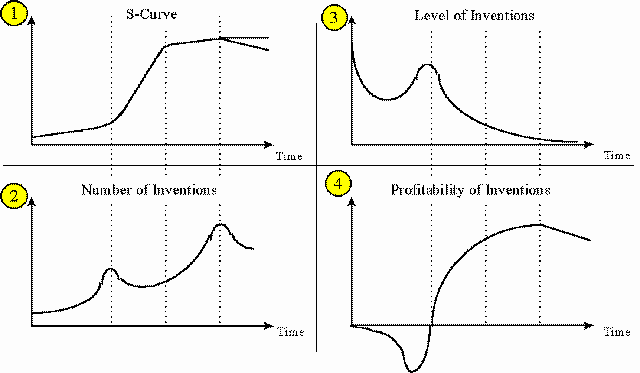
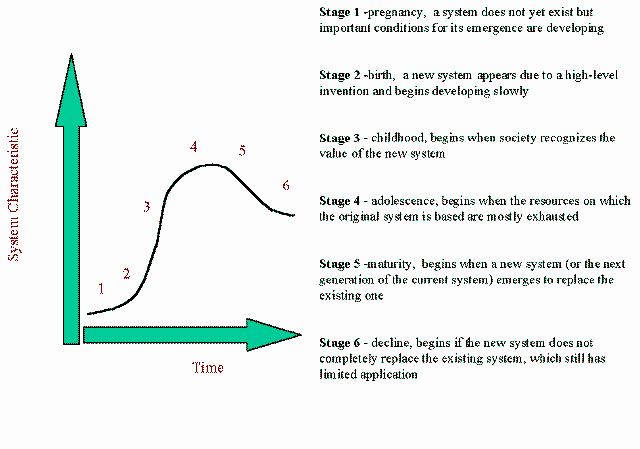
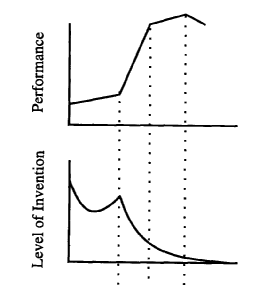
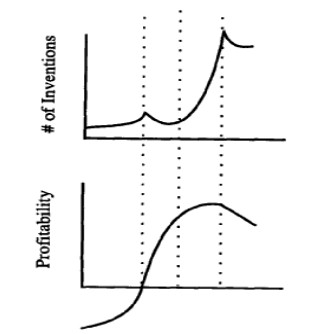
Evolution in stages is a macrolevel methodology aimed at the maturity mapping of an existing technology. The stages of the S-curve are pregnancy, birth, childhood, adolescence, maturity, and decline. Four curves plot the maturity of a technology from different perspectives: performance, level of inventions, number of inventions, and profitability, see Figure 1.0. The interpolation of these individual curves gives the analyst an indication of the technologies location on the S-curve.
Figure 1.0: These four curves plotted versus time indicate location of a technology in reference to the extrapolated polynomial fits of previously studied technologies.
2.0 SummaryHermetic sealing technology was selected as a prospect for maturity mapping due to recent strategic losses in the market by a major aerospace manufacturer. This once prominent technology comprised a large percentage of unit profits but had declined in profitability for the last several years. Data were collected relevant to the technology that would provide necessary information to create the required graphs represented in figure 1.0.
Performance
Hermeticity was selected as the primary performance characteristic to trend. Data concerning leak analysis was collected from literature and company specifications for the last forty years. This data was plotted as Figure 2.0.
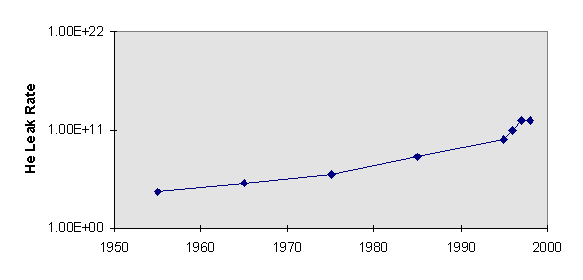
Figure 2.0: The reciprocal of the He leak rate has been plotted versus time. A positive slop for the time period 1955 to 1996 is realized but the current technology has leveled off at a theoretical minimum leak rate currently.
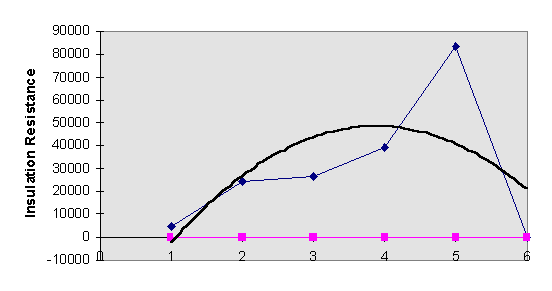
Figure 3.0: A second performance criterion was plotted for confirmation and the performance level was found to peak at earlier design phases. Recent customer specifications have dictated design changes that have shifted the system out of this parameters optimum range. Further increases of this performance level will require new technology.
Number of Inventions
The number of hermetic patents was collected from the company patent database and these figures were collected and plotted, see Figure 4.0, with the insertion of a second order polynomial fit. The trending indicates a peak of low level inventions in 1995 with a major decline 1n 1997. This would allude to the fact that variations and deviations may be exhausted.
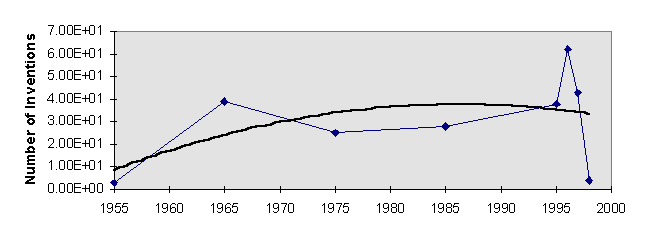
Figure 4.0
Level of Inventions
The associated aggregate level of inventiveness for the patents disclosed in Figure 4.0 are plotted below as Figure 5.0:
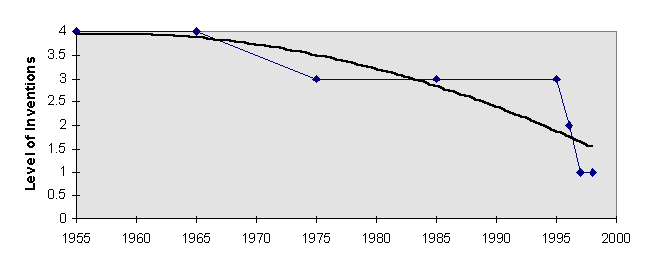
Figure 5.0: The average levels of the inventions are represented as aggregate scores indicative of the overall level of innovation in the hermetic field during the time frames indicated.
Profitability
Profitability and bookings were investigated and plotted in the following Figures 6.0 and 7.0:
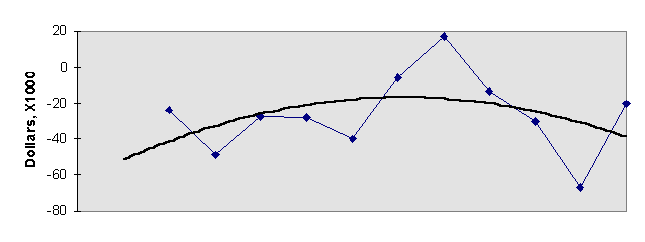
Figure 6.0: Profitability is plotted with reference to time and indicates a loss for the last five years (the total duration of the plot). This was highly indicative of the current status of the existing hermetic technology.
The stage indicators clearly placed the existing hermetic sealing technology in the declining stage. This is demonstrated by superimposing the predicted curves from Figure 1.0 over the experimental data from section 2.0. In each case the correlation suggests a declining status. A clear strategic implication was realized: abandon the technology or invest in the next S-curve, (superseding hermetic sealing technology). A decision was made to fund research into new technologies that would increase the performance indicators, yield numerous high level patents, and regain long term profitability.
The analysis performed allowed the research team to begin developing hermetic sealing technologies that exceeded the maximum performance criterion of the mature sealing technology. This coupled with the need to protect the technology by creating high level patents with numerous claims defined the team objectives nicely.
4.0 ResearchThe current glass used for hermetic systems exhibits a tendency to micro-fracture during processing. These fractures are contaminated with electrolytes from the plating procedure. These electrolytes degrade the insulation resistance of the glass (dielectric). The fractures also contribute in hermeticity failures. The scale of the borosilicate glass was evaluated and a decision to reduce this scale from millimeter to nanometer diameter conglomerates, see Figure 8.0, was made due to the previous published works of the Rensselaer Polytechnic Institute concerning nanophase materials. It was hoped that the nanophase borosilicate would exhibit grain boundary sliding (does NOT fracture) as opposed to grain boundary dislocating (fracturing), see Figure 9.0.
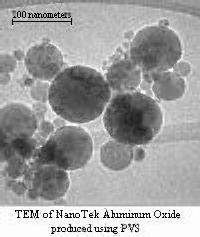
Figure 8.0
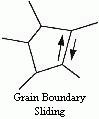
Figure 9.0
It is believed that this technology will provide the necessary technological invigoration as preliminary test results are promising and in large quantities the cost of the new material equals the cost of the current. The technologies represented by these high level inventions are the precursor discoveries of a new s-curve that is an overlapping curve (with reference to the existing mature curve), see Figure 10.0:
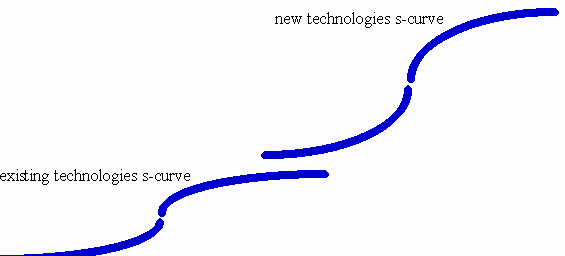
Figure 10.0: The new s-curve’s stage of inception is technologically more mature than the previous curves technological peak.
The ability to map technological maturity has enabled the strategic decision to invest in new technologies that will recapture market share and rapid profitability. This process was far superior to previous attempts to supplant existing technologies using trial and error development programs whose success was based on unpredictable eureka moments.
Appendix