First published in the Proceedings of the 11th Quality Function Deployment Symposium, Novi, MI, USA, June, 1999
Iouri
Belski
Department
of Communication and Electronic Engineering,
Royal Melbourne Institute of Technology University, Melbourne, Victoria,
Australia.
Fax: +61 3 9662 1060; E-mail: iouri.belski@rmit.edu.au
Keywords: MIR, TRIZ, QFD, problem solving, innovation, IFR.
Abstract.
This paper introduces an application of Method of the Ideal Result (MIR) to tasks other than technical. MIR is based on the TRIZ concept of the Ideal Final Result (IFR) and can be effectively used in product/service development/evaluation process. The application of MIR to engineering problem solving was presented at WISC 98, Sydney. This paper concentrates on a general MIR methodology, its relation with TRIZ and QFD. MIR application in finding ways of improvement of university student’s satisfaction is presented as an example.
“It is always cheaper to do things right the first time”.
Philip Crosby
1. NEEDS + RESOURCES = INNOVATION.
Everything evolves. Modern products and services are constantly replacing old products and services. New-fashioned companies and businesses are arising and continuously competing, even “demolishing good old ones”. Lately changes become more rapid. New “never bold” shampoos and banking by phone, fat free butter and purchasing on the Internet, naturally grown caffeine-free coffee, and a share market without proper share certificates… List of sensational innovations seems endless. Why does it happen? What rules the world of improvement and innovation?
Chris Russell (1998) concludes “Innovation stems from our twin needs to seek order – the continuance of things we value – and to seek novelty”. Today businesses struggle for survival. Companies are forced to be innovative. Russell (1998) reinforces this point further by saying “innovation is now a battle imperative rather than a matter of doing good business”. To survive in a battlefield of the world market, to achieve the best results in providing customers with new products and services exceeding their expectations, new ideas in thinking, and effective methodologies for problem solving are to be deployed. There are tens of reasonably effective innovative schemes. They also evolve as everything else. Edward De Bono’s (1990) Six Hats actually replaced Brainstorming. Gruputer software introduced to the Six Hats process by Max Dumas at DeBono Institute in Melbourne made Brainwriting technique ineffective. Why does it happen, why new products replace old ones, why services and even problem-solving tools are constantly changing?
There are two main incentives for a new product: needs and resources (term product will be used here as a general term to represent products, designs, services, etc.) The need for an effective way of communication existed thousands years ago. Mobile phones, however, appeared on the market only about a decade back – as soon as the appropriate technologies, materials and ideas became available. The resources to introduce uncertificated share holding were at hand as soon as computer databases came to existence. Number of share transactions however was low – need did not exist. Let us consider needs and resources separately.
1.1. Needs.
There are tree kinds of needs for a new product:
· Currently existing needs – needs imposed by a customer, internal company needs for improvement and needs dictated by products/plans of rivals. Management, improving an ineffective team work in a department; a communication provider expanding the area of coverage of the mobile phone network which is insufficient; a bank advertising “the best offer ever” to compete with the new flexi-plan introduced by a rival bank – are all examples of the needs of this sort.
· Needs which do not exist yet, but can be forecast. A portable wireless office (of the size of the notebook computer or less) which can provide a stable connection to the world from anywhere on the planet was the example of that sort only few months ago. Pocket chat-friends – ready to listen and give good advice (the next level of a virtual pet) can be predicted and will probably be available soon.
· Invented needs. Needs which neither exist nor can be forecast. Bright ideas may result in successful products that were not requested by a customer. 3M Post-it™ Notes and Tamagotchi, a virtual pet, were developed and introduced as invented needs.
1.2. Resources.
There are three kinds of resources that can be utilized to satisfy the needs:
· Already available resources. Humans and living organisms, technologies, materials, equipment, techniques, processes, etc. available at present.
· Resources which are not available yet to a full extent, however visible due to the achievements of scientific research and demonstrated practically. High temperature superconductivity and cloning are good examples.
· Resources not demonstrated practically, however existing in theoretical science. Quantum semiconductor devices and optical computers seem to be under practical development soon.
1.3. Innovation.
Innovation is based on the utilization of resources to satisfy needs. Needs are constantly changing and so are resources. Clear understandings of needs and awareness of resources lay the foundation for a company’s survival. Constant monitoring of both and a proper investment in research is an advantage. To succeed however, problem-solving schemes are of a crucial importance. Choosing the right strategy is not simple. Bob King (1998) presents a number of useful problem-solving tools. QFD, Taguchi Techniques, TRIZ are effective too. Most of these methodologies have been used by many people and work well. Nevertheless, they are still young in comparison to strategies used by Science and Engineering. Scientific methods have been numerously tested by the Time. They passed their exams successfully. What makes methods of Science and Engineering so effective?
2. MODELS OF REALITY.
Scientists and engineers always model a real situation. To predict a behavior of a proposed electronic circuit, for example, the circuit is simulated on a computer first. An engineer designing a new car tests its model many times in a wind tunnel, continuously correcting the model. Instead of building huge mechanisms, their scaled-down versions are often examined first. A performance of mechanical structures is modeled by using the electrical model – a circuit with appropriate elements. Computers make it possible to simulate the behavior of a mechanism and optimize it prior to spending any money on building even a model version. In a simulation, models of real devices are used. Models do not represent a behavior of the real mechanism in an entirely correct way. Nevertheless they can present it sufficiently accurate to provide a designer with a good evaluation of the real situation, saving time, money and reducing a probability of failure. Science and Engineering is based on models. These models are produced by research. There are many levels of models for every single physical act: from the ideal – the simplest, which fits in only for few real cases, to very complicated, applicable in most situations. When the modelled data disagree with the experimental data the model is refined, optimized further or can even be replaced by another model that represents the real behavior with the required accuracy. Science supplies engineering with models. Engineers apply these models and as feedback provide scientists with examples of no-applicability of a certain model. Often models are accompanied by a sequence of action steps to be taken to accelerate a solution process. Most models are constructed not to solve a specific task, but rather to find a right approach to a range of similar tasks. Gordon Glegg (1973) writes “The Engineering Scientist and the Natural Scientist travel the same road but sometimes in opposite directions. The engineer goes from the abstract to the concrete: other Scientists from the concrete to the abstract. The Astronomer takes most careful and exact measurements of a planet and then deduces its future position and movements in the form of abstract mathematical formulae. The Engineer’s work is the converse of this”. Companies and businesses are like engineers. To be successful they need realistic models of systems they are dealing with and tasks they are solving. Models are of significant importance for all tasks, especially the tasks with humans. Providing users with an appropriate model is a venture for problem-solving methodology.
Most effective problem-solving tools and idea generation methodologies are based on models. De Bono’s Six Hats grounds on principles of human psychology and brain chemistry. He proposes conducting analysis of a task in steps – deliberately putting on one hat (emotion) at a time. QFD uses the house of quality matrix to imitate expectations of a customer and provides a clear step by step way of analysis. TILMAG models a task defining a number of Ideal Solution Elements (ISEs) related to it. Later ISEs are placed into a matrix and considered in pairs to generate new ideas. Taguchi Techniques are based on statistical modeling. TRIZ’s Substance – Field (Su-Field) analysis represents a technical task as consisted of at list three elements: two substances and a field. It provides 77 standard solutions for different task models.
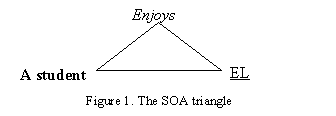
2.1. MIR’s Modelling.
MIR introduces a Subject-Object-Action (SOA) triangle as a model of a task. The SOA triangle, being somewhat similar to a Su-Field triangle, is based on the task’s Ideal Final Result (IFR). IFR then formulated correctly consists of a Subject, an Object and an Action between them. As soon as the SOA triangle for the task under consideration is formulated, step by step solution can be deployed. MIR’s general solution process consists of the following steps:
a). Formulating the IFR and defining the SOA triangle for the task.
b). Analysis of the model of the task:
b.1). Analysis of the SOA triangle:
b.1.1). Discovering reasons for conformance.
b.2). Analysis of the SOAA triangle:
b.2.1). Discovering reasons for non-conformance.
c). Listing all available resources.
d). Incorporating resources and reasons for conformance and non-conformance into a Subject – Object – Action – Resources (SOAR) diagram.
e). Analysis of the SOAR diagram and formulating Target Tasks (TT).
f). Solution of TT and suggesting actions to be taken.
Some steps of a solving process can be omitted. The technical task represented by the author elsewhere (Belski, 1998) was solved without creating the SOA triangle and the SOAR diagram. Steps b), and d) were dropped. For the tasks with humans, however, omitting steps is hardly possible. Technical tasks generally do not require as deep analysis as business, management or service tasks. As an example of MIR solution process to a task rather then technical let us apply it to a service problem.
3. THE TASK.
Australian Higher Education is becoming very competitive. Universities have started to rival each other for students. Student numbers are becoming survival numbers especially for traditionally teaching Universities like RMIT University. Both students and perspective students’ employers are emerging as University customers in the full sense of the word. Universities have started recognizing the critical importance of customer satisfaction. To survive and to be competitive an educational provider has to offer a student and a prospective employer, a level of service exceeding customer’s expectations. A student wants to be seen as an individual. Being under the budget pressure, however, Australian Universities increased their intakes, enlarging a number of students in lecture theatres to few hundreds, tutorial participation to 50 and laboratory classes to 25.
The author coordinates a core second year subject Electronic Engineering 2 (EL) with an enrolment of around 300 students. A highly diverse student backgrounds, knowledge levels and subject goals make the subject delivery difficult. The latest changes in the Australian Electronic industry and the following changes of requirements for university graduates also add to the complexity of providing a good education and making a student satisfied. The task of improvement of student satisfaction with subject delivery was chosen to be the MIR’s trial field.
3a). Formulating the IFR and defining the SOA triangle for the task.
The IFR for the task under consideration can be formulated as:
a student is fully satisfied with the EL delivery
(Now and in the following text bold font is used to represent the Subject, underline – to designate the Object and italic – to denote the Action). The Subject – a student, the Object – EL delivery and the Action – is satisfied are explicitly present in the IFR. The IFR can also be formulated as:
a student likes EL
There are numerous ways to phrase the IFR, nevertheless the SAO triangle for all of them will look similar and will consist of a student, EL and an action representing a level of satisfaction. To come up with the most elegant IFR, all verbs with the appropriate meaning can be listed and the best one chosen as the Action. Love, adore, enjoy, want to spend time, take pleasure from – are all possible Actions.
Let us proceed with the IFR: a student enjoys EL. The appropriate SOA triangle is represented on Figure 1.
The SOA triangle is a simple model of the task situation under consideration. The model consists of three elements – the lowest number of elements possible. More complex tasks consist of more elements, nevertheless, every complex task can be broken down to many three element ones.
It is said that the SOA triangle is satisfied then the task is solved – activities to be taken are discovered which satisfy the triangle. The model clearly indicates that the satisfaction of the SOA triangle is based on changes either to the Subject, or to the Object. Action of enjoyment must stay. Activities to correct the Subject and the Object are to be found.
3b). Analysis of model of the task.
Once a simple model of the task has been created, a standard way for finding ideas for the solution (activities to be taken) can be deployed.
3b.1). Analysis of the SOA triangle.
3b.1.1). Reasons for conformance.
Following the reasons for conformance (satisfaction of the triangle) are discovered.
3b.1.1.1). Reasons for conformance related to the Subject.
S.1 List as many Subject as possible that satisfy the SAO triangle (Who enjoys EL).
S.1.1. Person who loves electronics.
S.1.2. Someone who wants to become an electronic engineer.
S.1.3. Somebody confident that electronics will be in use in his future career.
S.1.4. Someone, who wants to understand how it works (small invention, discovery).
S.1.5. Anyone who sees electronics as something mysterious and exciting.
S.1.6. Young kids (they do not now that amazing results need hard work to be achieved).
S.1.7. Students who study challenging subjects with pleasure.
S.2. List as many motives for the Subject as possible to feel the Action. (Why a student enjoys?)
S.2.1. Own expectations are satisfied.
S.2.2. Somebody’s else (parents’/girlfriend’s/friend’s, etc.) expectations are satisfied.
S.2.3. Is proud of self.
S.2.4. Is proud of the place he/she belongs to.
S.2.5. Winning a prize, scholarship, etc.
S.2.6. Foreseeing coming employment.
S.3. State the goals of the Subject.
S.3.1. To be employed after all.
S.3.2. To receive a bachelor degree.
S.3.3. To have a good record (academic and/or management).
S.3.4. To receive a scholarship or to win a prize.
S.4. List all reasons which can make the generalised Subject to feel the Action. (Why a human being enjoys?)
S.4.1. To feel important.
S.4.2. To be independent.
S.4.3. To be rich.
S.4.4. To be sure of the future.
S.4.5. To be healthy.
S.4.6. To enjoy life.
S.4.7. To be known.
S.4.8. To be proud of the place of work/study.
S.4.9. To be the best.
S.4.10. To feel that others (boss) are satisfied with his/her performance.
3b.1.1.2). Reasons for conformance related to the Object.
O.1. List as many Objects which satisfy the SAO triangle as possible (A student enjoys what?).
O.1.1. Music, movies, TV, – doing nothing, having a pleasant time.
O.1.2. Parties, boy/girl friends, being with friends, playing games – showing off and showing achievements and strength of their own.
O.1.3. Making things – enjoy results of own effort.
O.1.4. Camping, travelling, diving, driving – adventures.
3b.2). Analysis SOAA triangle.
The diversion analysis is employed next. The original task is reversed. The Action is replaced by the Anti-Action. Enjoys is substituted by Hates. SOA triangle is reversed to SOAA triangle (see Figure 2). Reasons for non-conformance are analysed.

3b.2.1).
Reasons
for non-conformance related to both the Subject and the Object.
SA.1 List as many Subjects as possible that satisfy the SOAA triangle (Who hates EL).
SA.1. Someone who does not know what to do.
SA.2. Someone who does not understand the material.
SA.3. Somebody who dislikes teachers (voice, appearance, manners).
SA.4. Someone, who dislikes the place (rooms, corridors, etc).
SA.5. Anyone who needs to spent too much time with EL.
SA.6. Anybody who does not see the result of high own effort.
SA.7. A student who does not see a challenge in EL.
SA.8. Someone who does not understand the relevance of EL to own future needs.
SA.9. Someone who does not see the connection of EL to the real life.
SA.10. Somebody who dislikes subject material (text book, lab manuals, etc).
SA.11. A student who does not want to work (study hard).
SA.12. A student, who does not understand EL requirements.
OA. List as many Objects which satisfy the SOAA triangle as possible (A student hates what?).
OA.1. Lectures, classes, etc. – boring time spending.
OA.2. Not receiving an appropriate feedback from academics.
OA.3. Subjects that require too much of student’s time and effort.
OA.4. A structure of EL to be ambiguous.
OA.5. Unclear subject requirements.
OA.6. Teachers to be unfriendly and always too busy to talk.
OA.7. Teachers’ language to be unclear.
OA.8. Teachers not to look/behave professionally.
OA.9. Materials not to be related to real world problems.
OA.10. Subjects to be not challenging.
3c). Listing all available resources.
Michael French (1994) specifies three different kinds of medium to be of importance in the engineering design – materials, energy and information. TRIZ (Zlotin and Zusman, 1989) considers the following types of resources for a technical system:
Substance – any available material within the system or system’s surrounding, which can be used.
Energy Resources – any sources of energy available within the system or system’s surrounding, which are not used fully.
Information – any additional information which can be obtained about the system by means of available fields or materials.
Space Resources – any unused space.
Time Resources – any time slots in between, before or after technological processes, that have not been used fully.
Function Resources – a possibility for the system to perform extra functions.
System resources – new useful features of the system, which can be obtained by changing relations between parts of the system.
These types of resources are not applicable 100% to tasks with humans. Peter Senge (1995) mentions the importance of a human resource for building learning organisations. To be more suitable to tasks with humans, TRIZ resources were regrouped and the meaning of some groups had been changed. The following are the resources available for the task under consideration.
1. Humans and Living Organisms.
a) Academics, tute and lab tutors (Department’s).
b) Technical and administrative staff (Department’s).
c) University staff.
d) Students themselves and fellow students.
e) Employees of Electronic Companies.
2. Financial Resources.
a) Department money.
b) Faculty and University finances.
c) Grant, consultancy and entrepreneurs.
3. Substance Resources.
a) Equipment of different types.
b) Materials available.
c) Software (simulators).
4. Information – any available information and its sources.
a) Books and printed materials.
b) CD-ROMs and software.
c) Educational materials available in the Department.
d) Educational materials student available from friends and fellow students.
e) Libraries, LAN and WEB.
f) Students’ and subject team’s feedback.
g) Newspapers, magazines, advertisements, etc.
h) Companies’ information.
5. Space Resources.
a) Rooms: Lecture. Theatres, Tutorial Rooms, Laboratories, etc.
b) Corridors and walls.
c) Student cars and homes.
d) WEB and LAN.
e) Public transport.
6. Time Resources.
a) Time before the semester.
b) Time during the semester spent at: Lectures, Labs, Tutes, Library, Multimedia Room, Home.
c) Time for travelling to University and back.
d) Time spent waiting at the office door.
e) Walking from one room to another.
f) Time in lifts and waiting for lifts.
g) Lunch time.
7. Function Resources. Function of the subject delivery is teaching and learning.
a) Methods of learning.
b) Methods of thinking.
c) Procedures for effective reading and recording.
d) Techniques for successful public presentation.
8. System Resources. EL is a part of a system of Higher Education.
a) Other subjects of the course, their materials.
b) Other subjects of the Faculty and the University.
c) Department staff, faculty staff, University staff.
d) University students.
e) All of above at other Universities.
3d). The SOAR diagram.
The SOAR diagram for the task is represented on Figure 3. It consists of two distinct parts: the target with reasons for conformance and non-conformance and their ratings, and resources available. The target is made of three rings and a central circle with TT in it, which, stands for the Target Task. The external ring represents the Subject. The middle ring is shared by the Action and the Anti-Action. The internal ring identifies the Object. The target is divided into two halves. The right halve characterises the SOA model, the left – the SOAA model. The target is surrounded by the reasons for conformance and non-conformance. An arrows connects every reason with the ring it is related to. An arrow hitting the target represents conformance. An arrow leaving the target shows non-conformance. Reasons for conformance and non-conformance are rated according to their importance for the task solution. Five stars rating is the highest, one star – the lowest. To solve the task it is better to address all reasons. Time frame, however, dictates the most important issues to be looked on first, and the less important – last. Resources are located under the target and are assembled into eight groups. The SOAR diagram is drawn on one page, to clearly represent the task at one glance. Target Tasks can easily be formulated. To come up with a solution for a TT it has to be considered with every resource listed.
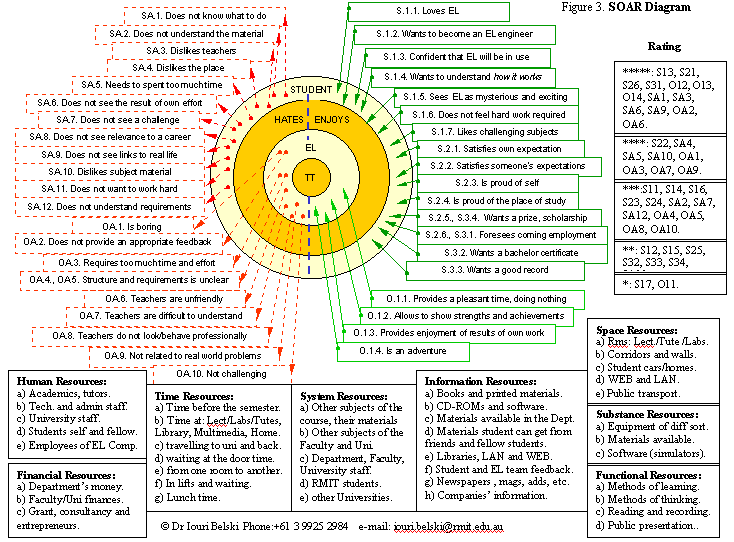
3e). Analysis of the SOAR diagram and formulating Target Tasks (TT).
As it was mentioned to come up with target tasks and ideas of actions to be taken to satisfy the SOA triangle, every reason has to be considered with every resource listed. As an example let us consider only one reason for non-conformance - SA.1. Does not know what to do.
The TT for the conformance of this reason can be formulated:
A student knows what to do in EL by himself, without involvement of a teaching team.
The following list represents resources that could realistically be deployed by the author:
· Human: 1a), 1b), 1d).
· Financial: 2a).
· Substance: 3b), 3c).
· Information: 4a)-4g).
· Space: 5a)-5d).
· Time: 6a)-6d), 6f).
· Functional: 7a).
· System: 8a)-8c).
Many actions may be taken to resolve the TT. Lecturer may write a clear Subject Guide, explain everything to students at the 1st lecture (every lecture). Tutors and lab demonstrators may support lecturers discussing what to do issue at the beginning of every tutorial or laboratory class. Posters may be put on walls everywhere (even special home posters may be printed). Letters and/or e-mails may be sent to a student prior/during a semester.
For the author’s point of view the Subject Centre on LAN/WEB is the most effective way of solving the TT at the Department. The computer-based Subject Centre is to consist of lecture materials, tutorial tasks with solutions, laboratory manuals, hints, subject hotline and a visual map of the subject. Both the semestral and the weekly maps of the subject to be available. On the opening of the Student Centre a student may enjoy the “joke of the week”. On the closing he will be asked to answer some questions of the on-line questionnaire to provide feedback to the teaching team. It also makes the outcome of quality improvement process to be measurable (Crosby, 1979). Possible solutions heavily depend on resources available. The best solution however can be achieved then as many resources as possible are utilised (Belski, 1998).
CONCLUSIONS.
As with most scientific and engineering methods, MIR grounds its problem-solving approach on the modelling of the real task. It also provides the appropriate steps to be undertaken for the effective solution. MIR employs TRIZ’s concept of the IFR to create the SOA triangle – the conformance model of the task. It uses the idea of diversion to produce the SOAA triangle – the model of the task for non-conformance. The SOAR diagram is a culmination of MIR. It represents the task and available resources on one page. The problem can be viewed at one convenient glance.
The SOAR diagram can also be used in preparation of the QFD house of quality matrix. The reasons for conformance and non-conformance can enrich the “what” room. The resources and TT’s can be useful in amending the “how” room.
REFERENCES:
Belski, I., (1998), I Wish the Work to be Completed by Itself, Without My Involvement: The Method of the Ideal Result in Engineering Problem Solving, Proceedings of World of Innovation and Strategy Conference, Sydney, 2-5 August, pp 194-199.
Crosby, P.B., (1979), Quality is Free: The Art of Making Quality Certain, McGraw-Hill.
De Bono, E., (1990), Six Thinking Hats, Penguin Books.
French, M., (1994), Invention and Evolution: Design in Nature and Engineering, Cambridge University Press.
Glegg, G., (1973) The Science of Design, Cambridge University Press.
King, R. and Schlicksupp, H., (1998), The Idea Edge: Transforming Creative thought into Organizational Excellence, GOAL/QPC, Methuen, MA, USA.
Russell, C., (1998), Honeywell’s Quest for Innovation, Proceedings of World of Innovation and Strategy Conference, Sydney, 2-5 August, pp 627-633.
Senge, P., (1995), Building Learning Organizations, in Foundations of TQM by J.G. Van Matre, Dryden Press, pp 375-391.
Zlotin B., Zusman, A., (1989), Laws of Evolution and Forecast of Technical Systems, Kartia Moldoveneske, Moldova, 114p, (in Russian).