Figure 1: The Innovation versus Optimization Dilemma
A version of this material was first presented at the I Mech E seminar on Future Heat Pump and Refrigeration Technologies held in London on 20 April 1999 (Reference 1).
Darrell Mann
Industrial
Fellow, Department Of Mechanical Engineering
University
Of Bath, Bath, BA2 7AY, UK
Phone: +44 (1225) 826465
Fax: +44 (1225) 826928
E-mail: D.L.Mann@bath.ac.uk
INTRODUCTION
Effective organisations understand where their products lie on the technology evolution characteristics relevant to the market in which they operate. A recent article by Michael Slocum (2) demonstrated how TRIZ tools and techniques allowed this strategic positioning activity to take place using the example of an industry sector currently at the infancy stage. This article seeks to build on that work by looking at a product family in the mature phase of its evolution path.
Products at the infancy stage often need no sophisticated analysis of performance, level of inventiveness, number of inventions or profitability to show that they are infants. Similarly, the strategic R&D decisions available to organisations at the infant stage are also usually straightforward; get the product to market and start paying back the R&D expenditure or go out of business.
Mature products on the other hand are less easy to categorise and strategic decisions on where to take the business next can be anything but clear-cut. A major strategic decision for companies in relation to a mature product is the perennial optimization versus innovation dilemma shown in Figure 1.
Figure 1: The Innovation versus Optimization Dilemma
The dilemma is essentially two-fold:
knowing whether or not there is another technology generation to innovate towards, and,
knowing how far along the s-curve the business is at the moment and, therefore, being able to balance the customer ĺvalueĺ of the current product versus the amount of R&D investment required to mature the new generation product to a state where it offers customers the same or preferably greater level of Ĺvalueĺ.
This article examines the mature product optimization/innovation dilemma and how TRIZ tools may be used to help provide organisations with answers to help determine the best way forward. The examination takes place through the case of the refrigerant compressor industry.
TRIZ TECHNOLOGY MATURITY DETERMINATION TOOLS
As illustrated in Michael Slocumĺs article, TRIZ recommends the use of four metrics to help in the process of determining where a product lays along its evolutionary s-curve ľ Figure 2 (Reference 3, pp205-7).
Figure 2: Altshullerĺs ĹLifelinesĺ
of Technological Systems
Each metric merits some discussion in light of the refrigerant compressor analysis which follows in the next section:
Performance ľ is often the easiest of the four metrics to obtain data for. Quantified performance data is the main output of R&D programmes; the world in which engineers live. The trick in terms of using performance data to establish product maturity is knowing which performance parameters to use in the analysis.
The difficulty here lies in the fact that relative importance of different parameters often changes as the product matures. This in turn results from the fact that engineers are usually required to focus on different parameters at different stages in product evolution ľ Figure 3. Thus a parameter like fuel burn was an irrelevance on early aircraft (where the emphasis was very much on getting speed and ability to get off the ground were considered much more important) and is now, on civil aircraft at least, the predominant performance measure.
The point is, recognising that there is a circular logic to selecting appropriate performance metrics; the performance s-curve for fuel burn, say, is an s-curve partly because during infancy virtually no attention was paid to it. In the final analysis, an assessment of patents for a particular product in relation to Figure 3 may be as effective a maturity determinator as any quantified performance analysis. It will also usually be significantly quicker.
Figure 3: Typical Invention-Focus S-curve
That being said, quantified analysis can often be important. Parameters related to product efficiency are commonly found to be the most appropriate measures upon which to base performance s-curve analyses.
(Particular care should be taken when using parameters which hit externally constrained limits. Example ľ the self-heating container analysis in Reference 2 uses Ĺbeverage temperatureĺ as one of the performance parameters. This is a good metric when the technology is in its infancy and there are difficulties in achieving adequate values, but as soon as the capability reaches the ceiling at which people are going to be scalded by the product, the parameter ceases to become relevant.)
Number of Inventions ľ usually the next easiest s-curve metric to obtain data for. Particularly in light of on-line patent databases and increasingly effective search engines.
The main problem here, however, relates to the eventual relevance of the patents emerging from the search. A search of the US patent database using the word Ĺcompressorĺ will produce several thousand patents only a small proportion of which will have anything to do with refrigerant compressors. Even a search of Ĺrefrigerant compressorĺ patents, however, still proved to be largely inadequate; producing over 440 hits, of which, less than half eventually turned out to relate directly to the refrigerant compressor problem under analysis.
The almost order of magnitude discrepancy between patents located during the Reference 2 study and the subsequent Invention Machine TOPE 3.0 search provides a vivid clue to the size of the problem here.
In the case of the refrigerant compressor analysis performed during this study, the analysis literally became a case by case examination of each and every one of the 440 plus hits.
Level of Invention ľ determination of level of invention using the definitions devised by Altshuller very much relies on a case by case evaluation of patents. It often entails analysis of the detailed patent description (i.e. the abstract is usually inadequate to make the assessment). A level of invention analysis on a product with considerable history like the refrigerant compressor can be an extremely time consuming process. It is not entirely clear, to this author at least, that the intensive time requirement is justifiable in relation to the benefit such an analysis gives.
Profitability ľ probably the most difficult of the four metrics to obtain useful, reliable data for. For a sub-system of a bigger product which in turn forms only a part of a large industry dominated by companies which produce a diverse range of other products ľ as is the case for a refrigerant compressor ľ the analysis may well be sufficiently difficult to be, to all intents and purposes, impossible.
Beyond the four metrics discovered by Altshuller, are a number of other methods which may be used to determine the maturity of a given product family. Such techniques have developed in the West. Although undoubtedly more crude than Altshullerĺs methods, they do exhibit a certain degree of commonality in approach and may thus have some validated merit if they are used as quick indicators. Two approaches are examined here:
Figure 4: Likely ĹNumber of Cost Reduction Inventionsĺ versus
Product Maturity Characteristic
Cost Reduction Related Inventions ľ in part derived from the sort of characteristic seen in Figure 3, examination of patents relating to product cost reductions can be an effective means of determining the maturity of a product. By Ĺcost reductionsĺ, we mean inventions which relate to making the product cheaper ľ such as improvements to manufacturing technology or method of assembly. Such inventions are relatively easy to spot from examination of patent abstracts and their preponderance increases as product maturity increases. A Ĺcost reduction inventionsĺ versus product evolution stage characteristic will look something like the illustration given in Figure 4.
Note: The curve closely correlates to both the ĹNumber of Inventionsĺ and ĹLevel of Inventionĺ characteristics drawn by Altshuller. ĹCost reductionsĺ are usually easier to spot.
ĹSymptom Curingĺ - Inventions which focus on curing problems which emerge as a result of earlier inventions again correlate closely to Altshullerĺs ĹLevel of Inventionĺ metric, but they too are usually relatively easy to identify and may be expected to follow the same sort of trend illustrated in Figure 4. Inventions which cure symptoms ľ as opposed to tackling root cause problems ľ include the sorts of add-on noise reduction devices described during the following refrigerant compressor discussions; designers added special noise mufflers to the compressors rather than solving the root cause problems associated with why the compressors were noisy in the first place.
REFRIGERATORS AND REFRIGERANT COMPRESSORS
Refrigerant compressor inventions were analysed as part of a piece of research examining the current state of the art and projecting where and when the technology might evolve to new states.
Figure 5: Typical Scroll-Type Refrigerant Compressor
According to Altshullerĺs analysis of the patent database, the large majority (77%) of patents fall into a category he described as ĹApparentĺ or ĹMinor Improvementsĺ. He also concluded that a further 18% came from within the same industry sector. The remaining 5% - the most significant advances ľ came from innovations generated by inventors who had looked beyond the horizons of their industry knowledge base.
An analysis of the 220 or so US patents granted for refrigeration compressors since 1971 indicates nothing that Altshuller might have classed as a major discovery. In fact, the patent profile appears strongly symptomatic of a technology at the mature end of its S-curve:
1)Thermal efficiency. While theoretically a good measure of performance maturity, it is nevertheless difficult to isolate efficiency improvements from other design drivers (Ĺspecific workĺ for example). No direct figures were calculable for any given individual sector of the industry. It was possible to correlate reciprocating type compressor performance improvement over time to improvements in internal combustion engine piston performance (Figure 6). The analogy hold good because patents in both sectors are strongly focused on reduction of losses ľ running clearances, valve characteristics, sealing, etc ľ rather than discovery of better overall compression methods.
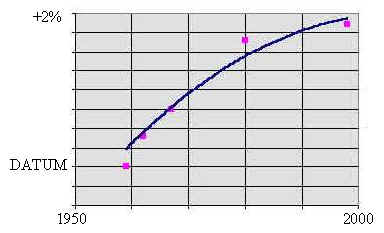
Figure 6: Estimated Refrigerant Compressor Efficiency Improvement versus
Time
(NB: A very important issue when looking at historical performance profiles is to ensure due account is taken of external legislation and the effect that it can have on industry R&D priorities (and invention profile for that matter). Figure 7 illustrates a performance-time curve for overall domestic refrigerators and the effect of 1993 Standards legislation. Not all of this overall efficiency improvement results from improvements in compressor performance.)
Figure 7: Change in US Domestic Refrigerator Efficiency versus Time
(Reference 4)
2) Number of inventions. Establishing invention count by year (Figure 8) is relatively easy provided due care and attention is taken in ensuring relevance of search engine hits to the actual problem at hand. The Figure 8 trend was constructed from a case-by-case patent analysis.
Figure 8: Number of Refrigerant Compressor Patents Granted By Year
3) Invention profile. An analysis of the refrigerant compressor patent profile by technology area is shown in Figure 9. The very large majority of the patents were found to be in the Level 1 or Level 2 categories ľ as evidenced by the very high proportion of patents focused on symptom curing issues.
Figure 9: Refrigerant Compressor Patent Profile
The profile raises a number of points regarding the state of the art and the potential for future developments:-
Noise/Vibration
Noise and vibration is a common symptom of a non-IFR system. Use of reciprocating compression systems inevitably leads to this type of issue. Almost a quarter of refrigerant compressor patents are inventions aimed at curing noise and vibration symptoms. In TRIZ terms, Ĺcuring symptomsĺ is design by compromise. The Ĺdesign without compromiseĺ approach would see noise and vibration problems tackled by looking at Ĺroot causesĺ. In TRIZ terms this might prompt searches for solutions outside the reciprocating piston or scroll compressor arena. This is an area considerably beyond the scope of this article, but it is nevertheless worth mentioning that similar root-cause analysis work on Ĺripple-less gear pumpsĺ is currently being successfully undertaken at Bath (5).
Fluid/Lubricant
Apart from the patents relating to non-CFC based fluids, the large majority of fluid and lubricant based inventions relate to either Ĺbetterĺ ways of supplying lubricants to moving components, or keeping lubricant and working fluid separate. In TRIZ terms again, these inventions are almost all design compromise based. Several are consistent with the Ĺtrimmingĺ trend as might be expected in such a cost-competitive industry ľ i.e. attempts to achieve more with less ľ but almost all are small incremental steps and almost none suggest a more radical roots-up design approach. Perhaps the closest is US patent 5,555,956 which achieves elimination of a separate lubricant by having itĺs lubricating function performed by another (already existing) part of the system ľ in this case, the working fluid.
Control
Almost a quarter of all refrigerant compressor patents since 1971 have related to control issues. An analysis of these patents in relation to the ĹAction Co-ordinationĺ technology evolution trend (Figure 10) appears consistent with the evolution of control-related inventions.
The trend correlates quite well with past evolution of, say, domestic refrigerator compressors: First generation Ĺnon-co-ordinated actionĺ systems involved the compressor motor being switched on permanently, irrespective of the temperature condition inside the refrigerator. Second generation Ĺpartial co-ordinationĺ systems include present day thermostat controlled systems where the thermostat simply turns a single speed motor on or off. Third generation Ĺco-ordinated actionĺ systems include systems where a thermostat controls a variable speed motor and, more recently, a small number of patents in which the motor speed control responds to temperature change rate as well as absolute temperature level.
Figure 10: Action Co-ordinationĺ Evolution Trend
(Picture based on TOPE 3.0 output)
There appear to be no patents associated with what TRIZ predicts as the fourth generation in the Ĺaction co-ordinationĺ evolution path. I.e. the third generation represents the current state of the art. According to the trend, future refrigerator improvements are highly likely to head in the fourth generation Ĺaction during intervalsĺ direction. By way of example of a beneficial improvement to refrigerator systems using an Ĺaction during an intervalĺ, it is perhaps useful to speculate on a refrigerator system which uses only cheap rate electricity and then possesses some form of energy store to provide the required cooling function outside cheap-rate times.
This use of one the Trends of Evolution vividly highlights the optimization versus step-change innovation dilemma central to the theme of this paper.
At the seminar at which this picture was first presented, it was far from clear that any of the refrigeration industry representatives present had even thought that there may be an evolution step beyond the current system. This is perhaps not surprising given their lack of previous exposure to TRIZ. Awareness now, however, means that the more enlightened will see the existence of a dilemma between continuing to optimize and improve existing ideas (in a manner which inevitably means focusing on cost reductions to maintain an acceptable profit margin) versus decisions to begin investing in the R&D required to innovate a new generation of capability.
The vast majority of evidence from history says that companies are far more inclined towards the optimization route. The same history says they are usually put out of business when someone else ľ usually a small new-start company ľ takes the innovation plunge.
CONCLUSIONS
TRIZ metrics for assessing the relative maturity of a technology have been successfully applied to gauge the maturity of the refrigerant compressor industry.
The metrics can often be difficult or even impossible to calculate accurately. In either event, the process of analysing a given industry sector can be both arduous and time consuming.
Use of simpler metrics like Ĺcost reductionĺ or Ĺsymptom curingĺ patents may offer quicker, qualitative assessment measures.
Product maturity knowledge is an important business metric. Companies need to know how mature their technology is.
They also need to know whether the technology has the ability to jump to new S-curves through step change innovations.
TRIZ predicted trends of evolution provide very potent means of making this kind of assessment.
Knowledge that a step change improvement is possible then gives rise to an optimization versus innovation R&D strategic decision.
Most companies opt for Ĺoptimizationĺ.
ĹOptimizingĺ companies eventually get put out of business by Ĺinnovatingĺ companies.
ôWealth in the new regime flows directly from innovation, not from optimisationů wealth is not gained by perfecting the known, but by imperfectly seizing the unknownö
(Kevin Kelly, ĺNew Rules for the New Economyĺ, Wired magazine)
REFERENCES
Mann, D.L., ĹDesign Without Compromise: A New Perspective on Refrigeration and Heat Pump Technologiesĺ, I Mech E seminar, London, April 20 1999.
Slocum, M.S., ĹTechnology Maturity Using S-curve Descriptorsĺ, TRIZ Journal, April 1999.
Altshuller, G., 'Creativity As An Exact Science', Chapter 7, Translated by Anthony Williams, (New York, Gordon And Breach, 1988.)
US Energy Information Association, http://www.eia.doe.gov/emeu/25opec/sld026.htm.
Mann, D.L., ĹDesign Without Compromise: A New Perspective On Fluid Power System Component Designĺ, paper to be presented at PTMCĺ99, Bath, September 1999.