
First published in the Proceedings of TRIZCON2001, the Altshuller Institute, March, 2001.
Joe Miller, Quality Process Consulting,
Ellen Domb, Ph.D., The PQR Group,
Ellen MacGran, Nabisco Brands Co., University of Phoenix,
John Terninko, Ph.D., Responsible Management
1. Abstract
ōSolve World Hungerö is frequently used as an example of an unsolvable problem. But, TRIZ can generate creative, practical, realistic ways of solving many of the components of the problem of world hunger. Specifically, more than 40% of the food that is produced does not reach the people or animals for which it is intended. This will be used as a case study to demonstrate the use of Su-Field modeling and the 76 Standard Solutions, using a variety of different constraints for different conditions around the world.
The flow chart shown in Figure 1 will be used as the basis for the case study, to illustrate how each of the 5 classes of the 76 Standard Solutions is used. Various aspects of the food provision (production/protection/distribution) problem will be explored.
2. Introduction
The 76 Standard Solutions (Ref. 1) are not new to the TRIZ community. As a collection of methods to identify and apply proven problem-solving templates, they can help the TRIZ practioner find solutions concepts for many kinds of problems. The Standard Solutions are grouped by constraints, so they can help the practioners find appropriate solution concepts quickly. They are more accessible to TRIZ newcomers than ARIZ, since the user is liberated from the ARIZ dictum of mastering every step before using any step. They are among the fundamental techniques that provide the foundation for all three commercial software products (Refs.2, 3, 4) that are used in conjunction with TRIZ. But, judging from the case study presentations at earlier conferences (Refs. 5, 6) the 76 Standard Solutions are not currently being used widely (in the English-speaking TRIZ community) for problem solving.
People learning TRIZ need case studies that illustrate the principles of TRIZ using terms and technologies that are familiar to them. The problem of providing food around the world is used to illustrate the application of the 76 Standard Solutions because it involves many technologies at many different levels of development, and requires the application of a wide range of technical, political, social and cultural constraints. It therefore provides a large family of problems that can help many people learn how to apply the 76 Standard Solutions, and it simultaneously offers an opportunity for the TRIZ community to contribute to improving global welfare. We note this topic should be discussed with a sense of caution. It is an arena where seemingly small changes can have extensive effects. Potential effects on people, animals, and eco-systems should always be examined with great care.
3. Brief Overview of the 76 Standard Solutions or
ōInventive Standardsö
The 76 Standard Solutions
The ō76 Standard Solutionsö of TRIZ were compiled by G.S. Altshuller and his associates between 1975 and 1985. They are grouped into 5 large categories or classes as follows:
| 1. Improving the system with no or little change | 13 standard solutions |
| 2. Improving the system by changing the system | 23 standard solutions |
| 3. System transitions | 6 standard solutions |
| 4. Detection and measurement | 17 standard solutions |
| 5. Strategies for simplification and improvement | 17 standard solutions |
|
Total: |
76 standard solutions |
The standards may be used as templates to which problems may be matched: They provide a concise description of the generic situation and generally include a statement of high-level constraints or restrictions.
Typically, the 76 standard solutions are used as a step in ARIZ, after the Su-field model has been developed and any constraints on the solution have been identified. The model and the constraints are used to identify the class and the specific solution. The 76 Standard Solutions can have broader application outside ARIZ, and can be used especially in those situations where a rudimentary model of the system can be developed. This model may be in classical Su-field format, or may follow a simple functional analysis approach. The approach can also be useful when there is no technical or physical contradiction observed.
The solutions in classes 1-4 frequently make the system more complicated, since many of them require the introduction of new materials or new fields. The solutions in Class 5 are methods for simplifying the system, making it more ideal. After deciding on a solution from classes 1-3 for a performance problem or class 4 for a measurement or detection problem, use class 5 to simplify the solution. See Figure 1 for a flowchart showing in more detail the use of the various classes of the 76 standard solutions for both problem solving and technology forecasting.
Generally accessible English language references with listings and explanation of the 76 Standard Solutions have recently become available. (Refs. 1, 7, 8, 9) They have also been compared and cross-referenced to the Inventive Principles (Ref. 10) and to other TRIZ Heuristics. (Ref. 9)
Details of Flow Chart
The flow chart organizes use of the 76 Standard solutions into three main pathways: System Improvement, solutions for Measurement and Detection, and use of the Standard Solutions for Forecasting opportunities for change. The System Improvement pathway typically begins with creation of a Su-Field Model of the specific problem system. Alternate pathways are then followed depending on whether system interactions are absent, inadequate, or even harmful.
Measurement and Detection applications are addressed by a single class of standards that begins with doing no measurement or detection at all and progresses through application of ferromagnetic particles and fields to system transitions and evolution.
The Forecasting branch provides an approach to address possible changes to a system, even when there is no specific need for improvement. Either or both minimal change and system change to the sub or super system may be considered.
All three principal pathways provide for further refinement of the solution, refinement of the problem statement and iterative application of the standards, and ultimately for use of Class 5: Strategies for simplification and improvement.
Three widely varied areas or segments of the World Food Supply Issue will be explored in the remainder of this article to illustrate use of the 76 Standard Solutions along these pathways. The examples in each of these segments are based on recent developments in the food provision process and the technologies and information systems that support it. Many of these systems, and the specific examples provided, are in flux. The actual consequences of some of these technology examples may be adverse and are still to be determined in the real world. The Standard Solutions in Class 5: Strategies for simplification and improvement, may be especially important for assuring that actions taken on these systems are well thought out.
Reference: John Terninko, Joe Miller, Ellen Domb. ōThe 76 Standard Solutions, with modern examples.ö Feb., March, May, June, and July, 2000, TRIZ Journal, <http://www.triz-journal.com>
4. The World Food Supply --- What is the problem?
What is the hunger problem?
Nobody denies that hunger is a problem in our world today. Every year, hunger and the diseases associated with it kill 12 million children under the age of 51. At the same time, we are a world that produces enough food to feed everyone amply, even while vast quantities of food are wasted2. There are many excellent organizations worldwide that are involved in generating solutions to this complex problem.
Example: Hewlett-Packard advertisement in 12-18-2000 Business Week Magazine. 100 billion pounds of food goes to waste in the US each year, and 31 million people go hungry. One problem is lack of communication. ResourceLink.org connects food manufacturers with Second Harvest and with trucking companies and other shippers. (www.resourcelink.hp.com <http://www.resourcelink.hp.com>)
So while hunger, on a worldwide basis, can be addressed as the result of production problems, it can also be addressed as supply, distribution, information, and many other types of more specific problems.
To address these myriad problems, and to help define the ōZone of the Problemö and the specific elements of the sub-systems we can improve, measure, or make predictions about, we developed a focusing tool in the form of a foodstuff lifecycle review.
Lifecycle stages were defined as:
|
DEMAND (Diet, Economics) |
PRODUCTION (Growing, Harvesting) |
DISTRIBUTION (Transportation, Storage) |
CONVERSION/ PREPARATION (Acquiring, Processing, Storage) |
UTILIZATION (Over / Under) (Delivery, Cooking, Consumption) |
DISPOSAL (Foodstuffs, Ancillary Materials) |
And as any particular problem was identified by brainstorming and other means, we identified it as a problem of Efficiency, Effectiveness, or Capacity/Capability. An abbreviated example table of this Lifecycle model is shown as Figure 2. This table proved very useful in identifying tangible portions of the overall food provision and consumption system. Those tangible portions or elements were much more amenable to focusing on the zone of the problem and subsequent problem formulation. Entries are labeled ōAö for those to be treated as system improvements, ōBö for those to be addressed by through the measurement / detection standards, and ōCö for those to be addressed for forecasting.
|
DEMAND |
PRODUCTION |
DISTRIBUTION |
CONVERSION/ PREPARATION |
UTILIZATION (Over / Under) |
DISPOSAL |
|
|
Efficiency |
A. Insects eat / attack plants, reducing yield |
A. Insects eat / infest grains |
A. Insect damaged / infested foodstuffs require additional processing / discard. |
C. Right Stuff, Right Time, Storage? Customization in response to shortage?? |
Insect damaged / infested foodstuffs require discard. |
|
|
Effectiveness |
Reduce demand? |
B. Right combination of fertilizers, water, etc at optimum timing for maximum production |
C. Can information / technical advances from efforts like Human Genome Project contribute to enhanced utilization? |
|||
|
C. Technologies for direct distribution to End Users are developing rapidly. How could those be used to change from Mass to Custom distribution of foodstuffs for satisfying world nutritional needs? |
||||||
|
Capacity / Capability |
Population growth? |
B. Can we locally measure effect and vary application? |
A. Limited availability of insect proof / resistant storage. |
Ability to utilize / reclaim waste foodstuffs and packaging materials? |
FIGURE 2 FOOD SUPPLY LIFECYCLE TABLE
We further identified a broad catalog of high-level constraints that might broadly affect food provision processes and problems. These were useful in characterizing more specific issues and problems.
|
Constraints |
|||
|
1. Growing Season |
7. Genetics |
||
|
2. Arable Land |
8. Water Availability |
||
|
3. Labor Supply |
9. Soil Chemistry |
||
|
4. Energy Availability |
10. Social Factors/Issues |
||
|
Animal |
11. Economic Policies/Issues |
||
|
Fuel for Mechanical |
12. Politics |
||
|
Fuel for Preparation / Cooking |
13. Shelf Life |
||
|
5. Information Availability |
14. Contamination Tolerances |
||
|
6. Fertilizers |
15. Environmental Issues |
||
FIGURE 3 CONSTRAINTS CATALOG (Partial)
5. Case Study Illustrative Applications
Case A. System Improvement Pathway - Illustrative Example: Insect Damage to Grain.
Insect damage is a major source of loss of food. By some estimates, insects and vermin together destroy 25% of the grain that is harvested. A separate problem is the destruction of crops in the field by insects, either by damaging the grain, or by damaging the plant that produces the grain. The first problem, insects eating stored grain, is an important problem and an excellent illustration of the System Improvement branch of the 76 Standard Solutions flow chart.
Following the flow chart explicitly, at the step ōFocus on the Zone of the Problem,ö there are several possibilities, as follows:
The first problem is an example of System Improvement when the interaction is ōabsentö-that is, there is an incomplete Su-field model, with one object, with nothing acting on it.
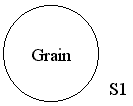
FIGURE 4 Unprotected Grain
Follow the route shown in Figure 1 for ōInteraction is Absentö, to the solutions of Class 1.1, which says, ōIf there is only an object S1, add a second object S2 and an interaction (field) F.ö In this case the obvious solution is to add something to protect the grain from insects, such as a grain storage bin. We show this schematically with a method of drawing models which is a derivative of the method developed by Zinovy Royzen as explained in J. TerninkoÆs February 2000 article in Ref. 1. See also Z. Royzen, ōTool, Object, Product (TOP) Function Analysis. ō September 1999 TRIZ Journal (Ref. 11)
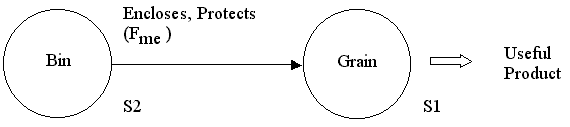
FIGURE 5 Grain Storage
The next step in this path in Figure 1 is ōUse Class 3 to refine the Solutionö and in Class 3 we find a variety of system transition suggestions, such as the creation of the bi-system, which could lead to the idea of a storage bin which both protects from insects and dispenses the grain.
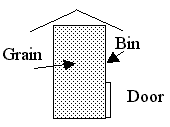
FIGURE 6 Grain Storage Bin
Next, the flow chart asks if this solution concept is sufficient. If it is, could it be more ideal? This continues the path for System Improvement. The bin, if properly constructed, is adequate to protect the grain from insect infestation, but it is not very good for releasing the grain. Class 5 is used to make the solution concept more ideal.
Solution 5.1 deals with introducing substances, 5.1.1 is indirect ways of introducing substances, and 5.1.1.1 is the use of ōnothingö such as voids, vacuum, holes, air, hollows, clearances, etc. This stimulates the idea of using an airspace to make it easier to dispense the grain, by lifting the bin off the ground.
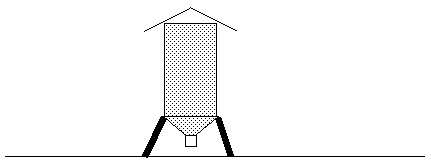
FIGURE 7 Modern Grain Storage Bin
If the insects are already in the grain before it is stored, eating the grain, the Su-field model is the harmful interaction model as shown:
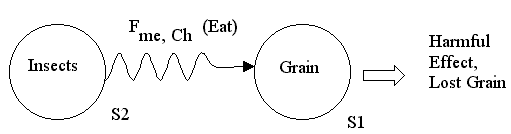
FIGURE 8 Infested Grain
In this case, use the branch of the flow chart shown in figure 1 as ōInteraction is Harmfulö, which leads to Class 1.2, ōEliminating or neutralizing harmful effects.ö Solution 1.2.1 says that if S2 and S1 do not have to be in contact, introduce S3. (Note: in the classical situation there are both useful and harmful effects. In this case, the insects do nothing useful, but they are there. So, eliminating them entirely is another option.) S3 could be an insecticide that kills the insects but does not harm the grain, and does not affect humans or animals. Methyl bromide is the most commonly used substance for this purpose, but it is thought to be harmful to the ozone layer, and considerable research is underway to find substitutes. Phosphine gas has shown promise against such pests as the lesser grain borer, the rice weevil, and the rusty grain beetle.
Alternatively, solution 1.2.2 applies to the same situation, but in circumstances where new substances cannot be added, and suggests that either S1 or S2 should be modified. The grain can be modified to taste bad to the insects. Note that time sequence is important when suggesting these solutions. If the insects are actively eating the grain, this solution wonÆt work. If certain kinds of insects are common in an area, and the farmers in that area plant grain that tastes bad to the insects, then this solution concept is not only useful, it is ideal-the grain protects itself, provided that the nutritional value of the grain is maintained.
Another approach is the creation of grain that kills the insects by interfering with their metabolism. Corn has been developed that has the protein avidin, which binds the vitamin biotin. Insects cannot convert their food to energy without biotin, so they suffer delayed development and death. This approach has been effective with maise weevils, indianmeal moths, Mediterranean flour moths, and others.
Research is also underway in several areas that could be described as ōmodifyingö the insects, by infecting them with any of a variety of parasites and fungi. The wasp Habrobracon hebetor, for example, attacks the indiameal moth and its larvae, but does not harm the grain.
Solution 1.2.3 specifies the situation where a field causes the harmful action, and suggests introducing an element S3 to absorb the harmful effects. This could work regardless of the time sequence. If the aroma of the grain attracts the insects, introduce a material that absorbs or neutralizes the aroma. Alternatively, introduce something that interferes with the insectsÆ ability to smell the grain. Odor neutralizers are being developed now for use against the red flour beetle.
Following the harmful interaction path on Figure 1, use Class 3 to refine any of these solution concepts. For the first example, using a chemical insecticide, Solution 3.2.1 suggests transition to a micro-level, which includes replacing objects by fields. A variety of fields can be used to kill insects, including ultraviolet and infrared radiation, heat, and ultrasound, depending on the species of insect. Heat treatment above 55oC is a promising alternative to the use of methyl bromide.
The path then continues through the decision whether the solution concept is sufficient, to reformulation of the problem if it is not, or use of Class 5 to make the solution more ideal, or use of the solution if the solution concept is adequate. In this case, solution 5.1.1.1, the use of nothing, sounds like a useful idea. Vacuum could be used to kill the insects, by pumping the air out of the container.
This method is used on ships to kill rodents, but it has mixed success in killing insects, since some species can endure long periods without breathing, and have hard shells that protect them from the effects of depressurization. An alternative is to pressurize the area with CO2 to drive out the oxygen, killing the insects by suffocation. As with all TRIZ solutions, detailed data are needed to validate any suggestion derived from the 76 Standard Solutions.
The relative level of ideality must also be tested. The cost of the vacuum pump and the energy to run it might be more than the cost of the lights or heat or ultrasound generator suggested in Class 3, or of the chemical insecticide from Class 1. Certainly the light, sound, and vacuum or CO2 solution concepts have the advantage of not leaving chemical residues that might harm the people or animals that eat the grain or of dissipation into the atmosphere. The Analytic Hierarchy Process (AHP) can be used to measure relative Ideality of solution concepts. This method allows considering several criteria for selection simultaneously. (Ref. 12)
Another Class 5 solution concept with no residues is from solution 5.3.3, using the phenomena that accompany a phase change. In this example, lowering the temperature of the grain below freezing will kill most insects when the water in their cells freezes, rupturing the cell membranes due to the expansion of water when it becomes ice. Once again the cost of the freezing mechanism and the energy to operate it must be compared to the cost of alternate methods to determine if an increase in ideality has in fact been achieved.
Reference 13: 1999 Annual Report of the Agricultural Research ServiceÆs Grain Marketing and Production Research Center, US Department of Agriculture. http://www.usgmrl.ksu.edu/report
Case B. Measurement and Detection Pathway - Illustrative Examples: Soil Fertility and Plant Genetic Modification.
System to be improved: Agricultural Production of Major Foodstuffs
Initial Problem Statement: Can soil fertility be enhanced and made to improve the overall effectivness of food production, especially for growing grains such as wheat, barley, soybeans, etc?
In the grain production areas of the U.S. and Canada, almost all grains are produced in very large fields, with extensive use of fertilizers and herbicides/pesticides. The maximum yield to be expected from each crop is determined by the plant genetics. It is known that increasing the gross amounts of fertilizers is effective up to a limit; beyond that limit further application may be wasteful and may even become counterproductive. Some farmers are beginning to see the need for increased fertilization to maintain yields because of soil deterioration. It is also known that there are localized variations of soil condition, microclimate, moisture levels, etc, within each field. These localized variations may occur over areas as small as a few square feet, or as large as several acres. Thus, the actual localized yields of grain may vary significantly within a field. Historically, fertilizers have been applied at a uniform rate across an entire field, and yields have been reported only in the aggregate, e.g. bushels/acre. The result of these practices is that some areas of a field may receive more fertilizer than is necessary, while other local areas may not receive enough.
Modern large-scale farm equipment provides a variety of ways to apply seed, fertilizers, herbicides, and pesticides. Many of these provide means to vary the application rate (pounds/acre) almost continuously as the appliance traverses the field, or they at least provide for frequent adjustment. Various fertilizers, herbicides, and pesticides may be applied up to seven or eight months before seeding, at the exact time of seeding, or during plant growth.
Large-scale harvesting of grain is done with ōCombinesö which cut the plant stalks, separate the individual kernels of grain from the plant head, and accumulate the kernels for transfer to a transport means for storage. These devices frequently include the means to measure the bulk yield, in bushels, as crops are harvested. Harvesting is done some four to five months after seeding.
To follow our flow chart and ōFocus on the Zone of the Problemö, it is clear that the pertinent events occur over long time cycles, and the problem may be reformulated as an issue of:
To re-state the problem: How to match the localized availability of agricultural additives and treatments to a plantÆs genetic ability to utilize them throughout the growth cycle.
Thus, our analysis has clarified the immediate need: to achieve or improve the measurement and / or detection methods for very localized grain yields and fertilizer and additives application. This directs us to apply Class 4, Measurement and Detection Standards.
The Resources Listing for this problem is extensive. An initial listing focuses on the resources immediately available to the farmer:
| Fertilizers | Plant |
| Grain Seed Stocks | Quantity or number of seed |
| Soil Matrix | Linear distance (plant spacing) |
| Soil Chemical Content | Time |
| Soil biology | Historical data |
| Soil Water | ----Fertilizer Application rates |
| Sunlight | ----Yields |
| Ambient Temperature | Data correlation |
| Air | Pesticides |
| Humidity (Water in Air) | Herbicides |
We will see below through our application of the Standards of Class 4 that there are actually additional resources routinely available to the farmer.
An initial Su Field Model is thus:
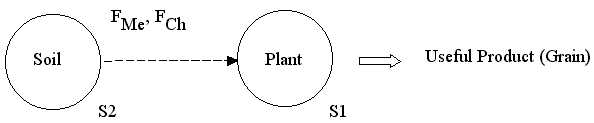
FIGURE 9 Grain Production
And we desire to transform this model as follows:
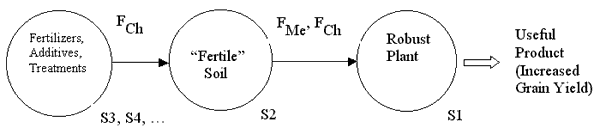
FIGURE 10 Grain Production
The standards in Class 4 offer us the following guides:
Standard Class 4.1. Indirect Methods
Standard 4.1.1. suggests we modify the system instead of detecting or measuring so there is no longer a need for measurement.
This is in effect the original approach to fertilizer applications; simply apply what fertilizers are available, and in the available amounts, with the available equipment. If the results are economically satisfactory, there is no need to perform measurement upon which more precise or sophisticated fertilization or soil treatment could be based.
Alternatively, this standard could lead to modification of the seed stocks themselves for the purpose of increased yield in low fertility conditions. This is in fact being done extensively through plant genetics, hybridization and genetic engineering.
Standard 4.1.2. suggests measuring a copy or an image, if 4.1.1 canÆt be used. Satellite Infrared photographic images of agricultural areas are used to estimate the density and extent of actual plant growth. These images can be measured to a fairly small scale and results correlated to previous applications of fertilizing and/or other remedial agents. For wide spread use, this procedure might require a rapid process time to make ōreal-timeö information available to the farmer. Further, it is expensive since it requires the acquisition and transmission of large amounts of image data.
Standard 4.1.3. suggests use 2 detections instead of continuous measurement, if 4.1.1 or 4.1.2 cannot be used. This suggests taking the satellite images and processing them only at key times during the growth cycle, rather than on a continuous basis for each geographic area.
Standard Class 4.2. Create or synthesize a measurement system. Some elements or fields must be added to the existing system
Standard 4.2.1. If an incomplete Su-field system cannot be detected or measured, a single or double Su-field system with a field as an output is created. If the existing field is inadequate, change or enhance the field without interfering with the original system. The new or enhanced field should have an easily detectable parameter that correlates to the parameter we need to know.
Systems for measuring the location of a farm implement in a field have been developed based on lasers. These require a fixed reference location and some equipment located to establish it. The yield data for each location in a field can then be recorded onto a detailed map of the field, and thus provide a means to determine where more fertilizers or other additives are required.
Standard Class 4.3. Enhancing the measurement system
4.3.1. Apply natural phenomena. Use scientific effects that are known to occur in the system, and determine the state of the system by observing changes in the effects. Inertial (gyroscopic) systems could be added to the harvesting systems so that the effect of moving the equipment through the field would record its position.
Standard Class 4.4
Standards in the class 4.4 provide guidelines for Measuring Fe-fields. We have not observed or encountered Fe-field applications in the World Food Supply cases we have studied, so we only mention these standards here for reference. It is conceivable that these standards might find application in the detection systems for soil micronutrients. The Standards in class 4.4 are discussed with examples in Ref. 1.
Standard Class 4.5. Direction of Evolution of the Measuring Systems
4.5.1. Transition to bi- and poly-systems. If a single measurement system does not give sufficient accuracy, use two or more measuring systems, or make multiple measurements.
This standard predicts what is now being done by a few advanced practioners of ōPrecision Farmingö such as in central Saskatchewan, Canada. A farmer there advocates and practices taking a ōsoil probeö for the top 12 inches of soil in a field for every 2 acre section. This data is accumulated into a ōgrid mapö with GPS location data and can be analyzed for insects, type of soil, moisture, macro and micronutrients, organic matter, topography, and other significant variables. . A further improvement would be to more precisely measure the ōyieldö, which is now commonly collected only as bushels. Measurements of the actual weight, moisture level, and protein content of the grain could be taken by precise location. These measures are now routinely taken only in the aggregate.
In addition, a new process, the measurement of electrical conductivity of the soil, guides where to take soil probe readings, instead of simply using a grid. Changes in electrical conductivity show where changes in soil conditions occur. Correlation to yields data provides an additional source of information to the farmer. (Ref 14)
Standard 4.5.2. recommends that instead of a direct measurement of a phenomenon, we should measure the first and second derivatives in time or in space. As in 4.5.1, this standard predicts data based analysis of the time and spatial trends of factors affecting yields, and their response to remedial efforts. This information can then be utilized in the planning of future remedial actions.
The flow chart for applying the Standard Solutions recommends using class 3 to refine the measurement systems that have been developed through use of the Class 4 Standards. In Class 3 we find a variety of system transition suggestions, such as the creation of the bi-system, which could lead to the idea of correlating the crop yields to more than just the application rate of macro-fertilizers. As we have discussed, this is now being done for micronutrients, and also for measurement of soil physical condition and local topography, organic matter content, and even insect population levels. (Ref. 15)
We now consider use of Standard Class 5 to make solutions more ideal.
Standard Class 5.1. Introducing Substances, includes 5.1.1.2 which recommends using a field instead of a substance. This has been done through use of the fields making up the Global Positioning System, as discussed above. Standard 5.1.1.5 suggests concentrating the additive at a specific location. This is now being done as agricultural implements are continuing to be developed to more precisely apply fertilizers, herbicides, and pesticides in specific relation to the individual seed.
Standard 5.1.2 calls for dividing the elements into smaller units. The use of GPS systems, improved application implements, and increased usage of computers for data storage and control reflects the application of this standard.
Other standards in Class 5 offer further suggestions for refinement of the solutions and concepts already considered. One separate example illustrates the importance of effective measurement / detection to the current state of refinement of todayÆs agricultural production practices.
The process of modifying the genetic structure of plants is actually done in bacterium that has the ability to be assimilated by the target plant to generate a genetic modification. The gene desired to be introduced into the plant is inserted into the genetic material of the bacterium. This process is inefficient, because of the requirement for specific spatial alignment of the nucleic acid structures involved, and complexities of cellular mechanisms, and may be successful in only one in 10 Million (or worse) individual organisms. The burden of searching for these successful transformations would require hundreds of researchers.
In state of the art practice, the gene with the desired effect is coupled with a gene known to cause resistance to an antibiotic, before insertion into the bacterium. This is a known and easily reproducible process. After the insertion of the genetic material into the bacteria, the organisms are cultured in plates with growth media containing the antibiotic. Only the individual organisms in which the transformation has been successful survive, all others are killed by the antibiotic. This makes detection of the desired organisms self-evident.
The successfully modified organisms are then cultured and applied to the target plant, which incorporates the modified genetic material from the bacterium.
This is an excellent example of applying Standard 4.1.1, modification of the system so there is no longer a need for detailed measurement. (Ref. 16)
Case C: Prediction Pathway - Illustrative Example: Food Distribution Processes
The problem of hunger (the problem of meeting the nutritional needs of every individual) will become more complex as the world population grows. Even those who argue that there is enough food production capacity to match expected population growth agree that we need to more effectively manage food production. The effective utilization of food will mean making sure that the right foods are grown/manufactured, and that they get to the people who need them, thus eliminating waste. "Right foods" means that the food meets the nutritional needs, is considered culturally and socially appropriate by the individual(s) using them and can be stored and prepared within the context of that individual's resources. (There is a wide variability in the level and types of these resources (cooking fuel, refrigeration, storage capacity, water, etc.)
At a high level, the current system looks like Figure 11. Please note that from a Systems Dynamics point of view, information could also be considered a substance:
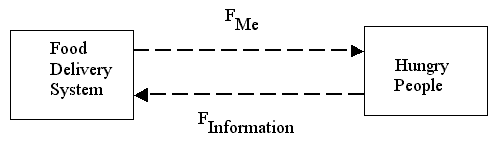
FIGURE 11
How should the system be modified as a result of the increasing requirement for efficiency and effectiveness?
Following the Flowchart for Using the 76 Standard Solutions, one is led to the ōForecastingö Pathway that begins with Class 2 Solutions, those which will require minimum change to the system.
2.2.1 suggests looking at a poorly controlled field that might be replaced or modified.
In our problem, the information field is often weak, perhaps including only population and aggregate caloric needs of the people. Could it be enhanced to include more information about individual needs? As the Human Genome Project continues, we will be able to more easily glean specific information about these nutritional requirements. Can we look for ways to effectively use that information?
Other improvements in this field might include the following considerations:
A change in the Food Delivery System from a macro level to a micro level is suggested by 2.2.2. This leads to the following ideas: Consider the delivery model in terms of its components: growers, manufacturers, food, shipping vessels, people, distribution stations. In doing this, we might begin to ask if trucks could be better utilized to carry multiple items that more closely match the needs, rather than large quantities of bulk items. Instead of large, single bay trucks or containers, could smaller compartments be used or smaller shipments? (Although Class 2 solutions are not meant to generate larger systems change ideas, one might ask here: Can we better utilize other delivery modes: air drops, pipeline, etc.)
Consider the food itself at a micro level: raw materials, in-process materials and finished goods, macronutrients and micronutrients. Macronutrients can be further broken down to carbohydrates, fats and proteins. Instead of a food being called simply "rice", could it be coded to contain more information that would include details about its nutritional value (This has been done with Nutritional Labeling in many countries.)? i.e., the so-called ōproteinö is actually a combination of several amino acids. Thus diets of combinations of rice and beans or corn and beans offer enhanced nutrition. A more extreme example of this concept is the so-called macro-biotic diet. By thinking of food at the micro level, we might be able to solve storage problems. A well-known example is milk, which has a short shelf-life, but when water is removed to create powdered milk, the shelf-life is significantly extended.
Consider the concept of need at a micro level: critical (preventing death), short-term sustainability (ongoing food supplies that prevent getting to the critical level) and long-term sustainability (providing the self-sustaining mode of food production/acquisition to communities).
Can we target food aid at a micro level? Instead of donating gross quantities of food to "Africa", can we move toward donating the "right" foods to individual communities?
Take a micro look at "aid". What are its forms? What are the specific information needs for each form? Do aid givers need to know how productive their efforts are? How can we get that information back to that level the Food Delivery System? If we get that information back, does it encourage more giving, in addition to improving the effectiveness of the system? Is the correct aid to provide fish for consumption, or to teach how to fish? Or even to teach how to produce fish? There are now organizations that focus their efforts on providing locally sourced reproducing livestock, and training, rather than actually distributing foodstuffs. (Ref 17)
The idea of changing S2 to something porous or capillary suggests making physical improvements. Can existing warehouses be better utilized? What more can be carried in the transportation vessels? Can the food itself be arranged to reduce the need for bulky packaging? Can the food delivery system accommodate other important non-food items (medication, clothing, etc.)?
As new infrastructure is built, do we need to think about smaller warehouses? This is an idea that goes beyond the Class 2 level of change, but one could certainly note it for future consideration.
Similarly, 2.2.1 asks how the system can be made more flexible or adaptable. How can intermediate storage facilities and shipping systems be utilized to accommodate a frequently varying mix of items, with their individual temperature and handling requirements? Can we apply the information gained from an organization like Webvan to the system of world food distribution?
As we begin to think about the more effective use of data, 2.2.1 leads to the thought of capturing this data in a predetermined format that can be used by the multiple actors in the food distribution system - growers, manufacturers and distributors. Nutritional data for food should be standardized in a way that matches nutritional needs of individuals.
Once food is delivered, 2.3.1 leads to consideration of the downtime of the individual resources used for that delivery (the people, the trucks, etc.) How can they be utilized?
What can be carried back in the truck? Perhaps the community ships its produced goods (food that it does not need, or any other manufactured items). Could the trucks provide transportation to people? Can the truck be left at the delivery site and used for some purpose - then later picked up when the next delivery is made? Perhaps the truck has refrigeration capacity that could continue to be used as the food is distributed over a period of time.
Moving on in the ōForecastingö pathway to considerations of a change to the super system or subsystem, Class 3 Solutions are considered. Immediately, 3.1.1 leads one to wonder how the Food Delivery System can be strengthened by merging with other systems? Can water delivery somehow match up with this system? Certainly, information about water needs is a part of the information needed to determine the best form of the food. What else is physically delivered to varying parts of the world? Are there new areas where these systems can work together synergistically? Do systems of information exist that can combine with the Information System regarding the needs of people?
What kind of control systems is needed when we link the information systems to the delivery systems? One can imagine the "food traffic report". Where is there a jam? What are the alternatives? At what points can changes be made to the "plan"? These are suggested by 3.1.2, which considers linking systems.
Consideration of the timing of the interaction of the information from the user and Food Distribution System is pointed to in 2.3.1, and the idea can be expanded when looking at 3.1.2. The Food Distribution System needs to be responding to current information about the needs of people. It also needs to be coordinated within the large network of its members. How do these individual users know when this information has been "consumed' and acted on by various members of the network? (Think of an Internet-based wedding gift list. Once you have selected one of the desired items on the list, it is marked as such so that there is no duplication of that purchase.)
These ideas might then lead to a more refined problem statement having to do with creating an information system that weaves together many different technologies. Could voice transmission, paper records and electronic data roll up into one central Information System that can inform the Food Delivery System? Of course, this is a problem that has been tackled in many industries.
Working this specific problem through Class 3 solutions makes sense because Class 3 deals with trends of technology evolution.
The linkage of these various forms of data is looked at in 3.1.2. Scanning paper data into a computer system, and, where phones are available, converting voice to digital systems are two ideas that immediately come to mind. Once all data is in digital form, it can easily be manipulated and then produce output in a variety of forms.
When a solution is found, make it more ideal by applying Class 5 solutions. If we choose the idea of moving from large, rigid storage facilities to more flexible storage, a number of ideas emerge by reviewing Section 5. 5.1.1 suggest using "nothing". Is it possible that some of our food items can be stored outside? Could we use existing space for storage? Could we store the food in the ground? 5.1.3 suggests using a storage structure that can eliminate itself after use. In some parts of the world foodstuffs are safely stored in the open air, in a frozen state. The storage system does effectively eliminate itself at the end of winter.
6. Conclusion
ōSolve World Hungerö is frequently used as an example of an unsolvable problem. But, the methods of the 76 Standard Solutions in TRIZ can generate creative, practical, realistic ways of addressing many of the components of the problem of world hunger. We invite the TRIZ community to join us to expand and make use of the Food Supply Lifecycle Matrix that defines elements of the problem, to develop solutions to those specific problems using any of the techniques of TRIZ, and to propagate the solutions to the companies, charitable agencies, governmental agencies, and people who can put them to use to truly END world hunger.
We have not addressed any examples from the initial ōDemandö phase of the lifecycle model we presented above, even though this area clearly offers great opportunity for TRIZ application. Many of us as children were urged to ōclean your plateö, and were perhaps trained to over consume. Our future population growth, social customs and consumption patterns may well be considered as processes to which we should apply the 76 Standard Solutions.
The Food Supply Lifecycle Matrix and discussions about this challenging opportunity are accessible through a TRIZ-World Hunger E-Group. We invite you to contact any of the authors via our addresses below to join that group. Your comments, suggestions, and shared problems and solution concepts will be accessible through the TRIZ_Journal.
Footnotes:
References
Author Information
Joe Miller, Quality Process Consulting
225 Sebby Lane, Lake Zurich, IL 60047 USA
Phone: 847-438-3405 Fax: same
jam@mcs.net
Ellen Domb, Ph.D.
The PQR Group, 190 N. Mountain Ave., Upland CA 91786 USA
+1(909)949-0857 FAX +1(909)949-2968
ellendomb@compuserve.com or
Ellen MacGran
Nabisco Brands Co., 100 Spear St. Suite 1630, San Francisco, CA 94105 USA
415-547-1980 FAX 415-547 1988
macgrane@nabisco.com
John Terninko, Ph.D., Responsible Management
62 Case Rd., Nottingham, NH 03290-5507 USA
Phone: 603-659-5186 Fax: 603.659.6419
john@terninko.com